Publication

Publication
Authors
Claudia Montanía
Publication Date: April 2025 | Publication Number: az2121

How much of Arizona’s agricultural production remains in-state to be consumed by Arizonans? This question is increasingly of interest considering the structure of our food system and the connection between agriculture and the use of water and other natural resources. Proponents of local food efforts cite a number of benefits of consuming local foods, including strengthening the local economy, improved taste and nutrition compared to non-local foods, and environmental benefits (Deller et al., 2020; Michigan State University Extension, 2013). However, the question of how much of the state’s agricultural production remains in-state is quite difficult to answer as there is no established method for accurately estimating local consumption of locally produced food (Conner et al., 2013). 

Local consumption of agricultural products involves direct consumption by households. In many cases, however, agricultural production is also used as an input for other production processes. For example, dairy cattle consume alfalfa as feed, and then those cows produce fluid milk, some of which is transformed into cheese and butter for final consumers. Although alfalfa is not consumed directly by Arizonan residents, it supports the production of food commodities consumed in-state. Considering that Arizona- produced goods can be transformed into final products in- state or out-of-state, estimating local consumption becomes very complex.

The popularity of local and regional foods has grown in recent years. Perhaps more significant in magnitude, however, is the supply of foods and agricultural products sourced locally or regionally by design or necessity but not necessarily marketed as local. Essentially, Arizonans may be consuming local food without knowing it. Here, we estimate the value of Arizona-grown agricultural products that are consumed in-state. We examine three groups of commodities that contribute to the share of Arizona’s agricultural production that stays in-state: vegetables and melons, fluid milk, and feed crops.

Summary of findings

In 2021, the total value of Arizona's agricultural production was nearly $4 billion, of which 37% was exported to foreign markets (Table 1). Cotton is an example of a heavily exported Arizona-grown crop, with 82% of production exported in 2021. The remaining 63% of the state’s total agricultural production, by value, was either consumed in-state or shipped domestically to other states. Our estimates show that livestock feed crops have the highest percentage in-state consumption, at 78% of theproduction value. An estimated 22% of Arizona fluid milk production was consumed in-state in 2021. For vegetables and melon, in-state consumption represented only 7% of the state’s production.

Table 1. Summary of Results 2021 (Million U.S.$)

 
 Vegetables & Melon
Fluid MilkFeed CropsAll Other Arizona AgTotal
Value of Arizona Production 

$734 

$848 

$523 

$1,886 

$3,991 

Value of Foreign Exports 

$137 

$47 

$88 

$1,198 

$1,470 

Value of In-State Consumption 

$48 

$186 

$435 

--

--

Value of Out-of-State Sales 

$549 

$615 

$0 

-- 

-- 

Foreign Exports as % of Value of Production 

19%

6%

17%

64%

37%

Value of In-State Consumption as % of Value of Production 

7%

22%

83%

--

--

Value of Out-of-State Sales as % of Value of Production 

75%

73%

0%

--

--

In Figure 1, we can see how Arizona’s production of these three commodity groups (feed crops, fluid milk, and vegetables and melon) is destined for different uses and market channels. Estimates show that these agricultural products are either shipped to other states as final products or are used as inputs within more sophisticated value chains, both in other states and in Arizona. This suggests that most of Arizona’s production of these commodities serves to meet national demand, both within households and industries. In the case of feed crops, most of what is produced remains in Arizona to support the livestock sector.

Image
Uses of Arizona Feed Crop, Fluid Milk, & Vegetables & Melon Production

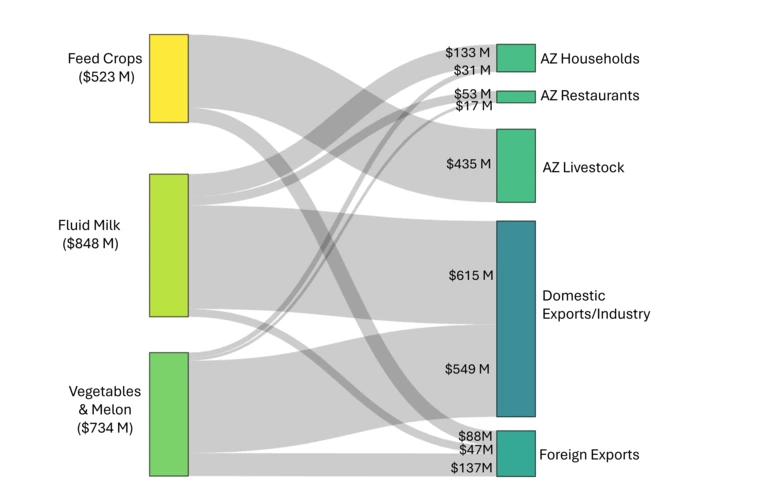
Figure 1: Uses of Arizona Feed Crop, Fluid Milk, & Vegetables & Melon Production

Vegetables and mellons

Western and Central Arizona, particularly the Yuma area, play niche roles in the production of specialty vegetable and melon crops (Duval, 2023). Because of their geography and climate, during times of the year when domestic production of leafy greens, other vegetable, and melon crops is not feasible, Western Arizona, and at times Central Arizona, may serve as a leading or even exclusive sources of certain commodities at the national level. Western Arizona is recognized as an important location for the production of winter vegetables, particularly leafy greens such as iceberg lettuce, Romaine lettuce, other lettuce, and spinach. Other top commodities produced in Western Arizona by weight include celery, cantaloups, cauliflower, broccoli, watermelon, and cabbage. Top specialty crop commodities produced in Central Arizona by weight include cantaloups, watermelons, honeydews, and other mixed and miscellaneous melons, as well as cabbage, broccoli, iceberg lettuce, herbs, and kale.

In 2021, Arizona produced more than 2 billion pounds of lettuce, spinach, and cantaloupes, equivalent to approximately $733 million in value, and exported 18% of it to foreign markets (U.S. Census Bureau, 2023). To better understand how much of this produce stays in-state, we estimate household consumption of the main vegetables and melon production. We assume that in any month when Arizona grows at least half of the national supply of crops (including imports), local stores would mostly buy from Arizona farms. We use per-capita loss-adjusted consumer availability1 data of vegetable and melon commodities in the U.S. to estimate Arizonans’ actual consumption. In- state consumption is estimated by subtracting Arizona’s monthly produce demand from its monthly production— but only during months when Arizona provides at least 50% of the total U.S. supply (Figure 2). In those months, we assume that Arizona-grown produce can fully meet local demand, as long as the amount produced is equal to or greater than what Arizonans consume.

Image
Estimated Arizona-Grown Fresh Produce Consumed In-State by Commodity

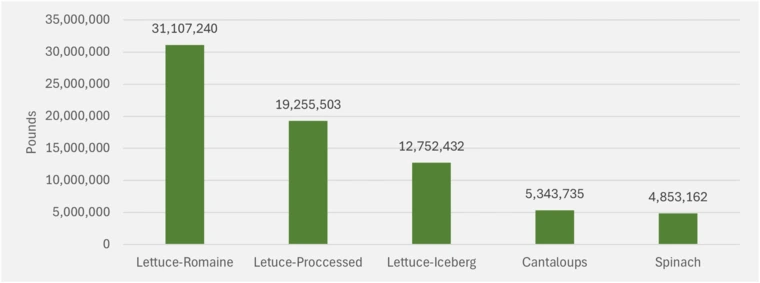
Figure 2: Estimated Arizona-Grown Fresh Produce Consumed In-State by Commodity

The estimated value of household consumption is $11.5 million for romaine lettuce, $9.3 million for iceberg lettuce, $1.7 million for cantaloupes, and $8.1 million for spinach, which in total represents 4% of the total value of vegetable and melon production in Arizona.

Due to the complexity of the food supply chain, in- state retailers and wholesalers may not necessarily source Arizona-grown produce first before out-of-state produce, especially considering the state’s proximity to California. Nonetheless, this is a conservative estimate due to the assumption that supply is sourced from in-state only when Arizona represents 50% or more of the national supply, in a given month. Local production also supplies restaurants and schools in Arizona, totaling an equivalent of $17 million of vegetable and melon in 2021 (IMPLAN Group LLC, 2021).

Household, restaurants, and schools’ consumption and foreign exports account for 28% of production. The remainder is shipped domestically to other states or used for other productive processes either in Arizona or elsewhere in the United States (U.S. Department of Transportation, 2017).


1 Per-capita loss-adjusted consumer availability was taken from the Loss-Adjusted Food Availability (LAFA) database provided by USDA ERS. This data serves as a proxy for actual consumption at the national level. It is derived from food availability data by adjusting for food spoilage, plate waste, and other losses to more closely approximate actual consumption.

Feed crops

Feed grain production primarily supports the dairy industry in Arizona. In 2021, Arizona produced 2 million bushels of barley, 3.3 million bushels of corn for grain, 2.1 million tons of corn silage, and 2.3 million tons of alfalfa (USDA, 2021). To calculate crop production that stays in Arizona, we assume that all production not exported to foreign countries is consumed in-state by livestock. Under these assumptions, we estimate that in 2021 over 90% of the barley and alfalfa produced in Arizona were consumed in-state by livestock. The estimated consumption is $9.8 million for barley and $408 million for alfalfa. Similarly, over 70% of locally grown corn for feed remains in Arizona for the same purpose, with an estimated value of $18 million.

Image
Estimated Feed Crop Production Consumed by Livestock In-State by Commodity 2021

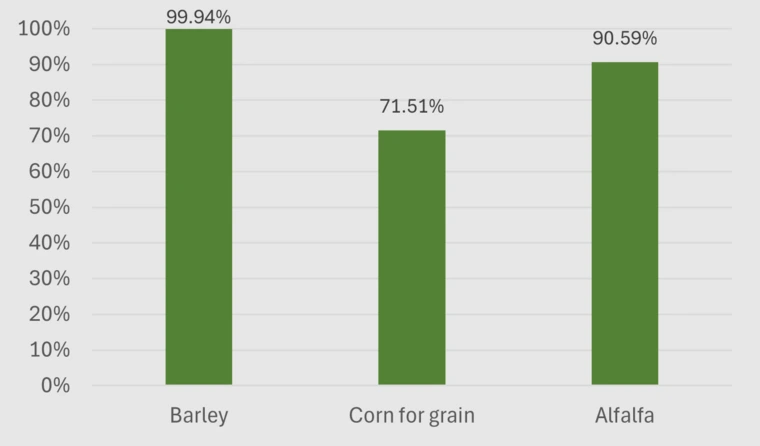
Figure 3: Estimated Feed Crop Production Consumed by Livestock In-State by Commodity 2021

Fluid milk

Though not often marketed as local, fluid milk is typically produced within close proximity to where it is consumed due to its highly perishable nature. In Arizona, dairies are concentrated in Central Arizona in Pinal and Maricopa counties (Bickel et al., 2018), well-situated to supply the Phoenix and Tucson metro areas which represent a large majority of the state’s population. In 2021, Arizona dairies produced 4.8 billion pounds of fluid milk, an estimated $848 million (USDA NASS, 2023). Of total production, $47 million was exported to foreign markets (U.S. Census Bureau, 2023), 6% of total production by value.

To calculate local consumption, we first estimate statewide household demand for fluid milk. We assume that Arizonans consume the national average per- capita amount of fluid milk annually. Hence, household consumption is estimated at 754 million pounds (equivalent to $133 million and 16% of total production in Arizona by value). Part of Arizona’s fluid milk production is used by other local sectors, such as restaurants and schools, with purchases totaling an estimated $53 million in 2021 (6% of total production by value). We assume milk purchased by restaurants and schools is consumed locally. Therefore, counting consumption by households, restaurants, and schools, 22% of the production by value of fluid milk is directly consumed, while 6% goes to international markets.

The remaining 72% (an estimated value of $615 million) stays in the United States. Some of it is transformed into other dairy products, such as concentrated, condensed, powdered, or sweetened milk or cream, butter, and whey, among other products. A previous study focused on analyzing the Federal Milk Marketing Orders (FMMO), found that in 2017 the FMMO 131 (the only FMMO in Arizona) sent 3% of its fluid milk production to the Southwest FMMO region, made up of New Mexico and Texas (Hanon, 2023). With this information, and assuming that the productive structure did not change significantly between 2017 and 2021, we can say that 69% of fluid milk production (an estimated value of $585 million) stays in Arizona for processing. Further research is needed to understand post-processing value chains for Arizona’s processed dairy products.

Discussion

Our estimates show that much of Arizona’s production of feed crops, vegetables and melon, and milk is consumed in-state, either directly by people or indirectly by livestock. Fresh vegetables and melon, and fluid milk are directly consumed by households, restaurants, and other food service establishments. In the case of vegetables and melon, only 7% of the local production is consumed by Arizonans. Most of it is shipped to other states (75%). Local milk production is also mostly sent to other states (73%) and an estimated 22% is consumed locally in Arizona. Feed crops, on the other hand, are used as intermediate inputs for livestock production, 83% of which are consumed in- state, and 17% are exported to foreign markets.

These commodities and the resources used to produce them, including water, are used in part to satisfy local demand. Beyond local demand, the remaining production is exported or used to fulfill domestic demand in other parts of the country. Recently, controversy has arisen around the issue of “virtual” water exports from Arizona to foreign countries through the export of water-intensive crops. Such issues concerning the use of the state’s limited water resources are important considerations in grappling with the ongoing water crisis in the West, however, there are important nuances to consider.

Our findings highlight the need to make a distinction between a foreign “virtual” water export and a domestic “virtual” water export. Crops are grown as intermediate inputs to other industries, so assessing the water footprint generated by domestic processing could give insights into water use pressure in Arizona.

To understand the issue of water use in agriculture more comprehensively, it is helpful to look at how much water is used to grow crops for direct consumption and how much goes into crops that are later turned into value-added products. In other words, we need to identify the water footprint by type of use – household, food service and school, livestock, and foreign and domestic exports. To accurately quantify these footprints, we need up-to-date consumptive use data. However, accessing a good estimate on water use/consumptive use/water withdrawals, evapotranspiration, and related variables by crop remains a challenge.

In summary, the question of how much Arizona’s agricultural production is consumed in-state is a kick- start to continue exploring the intersection between water policy and our food system. Improved methodologies and data on domestic trade in agricultural products could inform a much deeper understanding of how water moves “virtually” around the country and around the world. This may lead to new insights into where efficiencies and more responsible stewardship of limited natural resources could be achieved.

References

  • Bickel, A. K., Duval, D., & Frisvold, G. (2018). Contribution of on-farm agriculture and agribusiness to the Pinal County economy. University of Arizona, Cooperative Extension: Tucson, AZ, USA.
  • Conner, D., Becot, F., Hoffer, D., Kahler, E., Sawyer, S., & Berlin, L. (2013). Measuring current consumption of locally grown foods in Vermont: Methods for baselines and targets. Journal of Agriculture, Food Systems.
  • Deller, S. C., Lamie, D., & Stickel, M. (2020). Local foods systems and community economic development. Local Food Systems and Community Economic Development, 4-30.
  • Duval, D. (2023). Arizona’s Seasonal Role in National Supply of Vegetable & Melon Specialty Crops.
  • Hanon, T. M. (2023). Mapping Milk: Investigating the Effects of Federal Milk Marketing Orders on the Geography of Milk Production and Inter-Regional Trade in Milk and Dairy Products. University of California, Davis.
  • IMPLAN® model, (2021) Data, using inputs provided by the user and IMPLAN Group LLC, IMPLAN System (data and software). www.IMPLAN.com
  • Michigan State University Cooperative Extension (2013). 7 Benefits of Eating Local Foods. Retrieved from https:// www.canr.msu.edu/news/7_benefits_of_eating_local_ foods
  • United Dairymen of Arizona. (n.d.). Who we serve: Customers. United Dairymen of Arizona. https:// www.uda.coop/who-we-serve/customers
  • U.S. Department of Transportation, Bureau of Transportation Statistics; and, U.S. Department of Commerce, U.S. Census Bureau. (2022-07-27). SPC01 - CF1700A21, Geographic Area Series: Shipment Characteristics by Origin Geography by Destination Geography by Selected 5-digit Commodity by Mode. [custom tabulation]. 2017 Commodity Flow Survey.
  • USDA NASS (2021). Arizona Agricultural Statistics. Retrieved from https://www.nass.usda.gov/Statistics_by_State/Arizona/Publications/Annu… Statistical_Bulletin/2021/AZA nnualBulletin2021.pdf
  • USDA ERS (2023). Loss-Adjusted Food Availability (LAFA). Retrieved from https://www.ers.usda.gov/data-products/food-availability-per-capita-dat…
  • USDA AMS (2023). Fresh Fruit and Vegetable Shipments. FVAS-4 Calendar Year 2022. Retrieved from https://www.ams.usda.gov/market-news/fruit-and-vegetable-movement-reports
  • Vermeulen, S. J., Campbell, B. M., & Ingram, J. S. (2012). Climate change and food systems. Annual review of environment and resources, 37(1), 195-222.
Publication
Authors
Kunal Palawat
Leif Abrell
Aminata Kilungo
Jean McLain
Rob Root
Mónica Ramírez-Andreotta
Publication Date: March 2025 | Publication Number: az2112S | View PDF

This publication is also available in English.

El informe de progreso de las Naciones Unidas sobre el desarrollo sostenible afirma que 2.3 millones de personas viven en países con estrés hídrico y que la escasez de agua podría obligar a la migración de más de 700 millones de personas para el 2030 (Naciones Unidas, 2021). A medida que el cambio climático empeora la escasez de agua (Schewe et al., 2014), los Estados Unidos e incluso los arizonenses dependerán más de fuentes alternativas de agua (Pearson et al., 2015; Tamaddun et al., 2018), como el agua de lluvia recolectada de las azoteas (RHRW por sus siglas en inglés). En Arizona (AZ), el residente promedio usa 120 galones (454.2 L) de agua por día; este uso municipal contribuye al 20% del presupuesto de agua del estado. En comparación, el 78% se asigna para usos agrícolas y el 1% para usos industriales (Departamento de Recursos Hídricos de Arizona, s.f.). Hasta el 70% del agua residencial se utiliza para actividades al aire libre como la jardinería y el llenado de piscinas, y ese número aumenta durante los meses más cálidos (Departamento de Recursos Hídricos de Arizona, s.f.). Además, para hacer frente al efecto de isla de calor urbano, que afecta de manera desproporcionada a las comunidades de justicia ambiental, se están desarrollando intervenciones de bajo costo y adaptaciones al cambio climático, incluida la recolección activa de agua de lluvia para apoyar el aumento de la copa de los árboles en estas comunidades (Sandhaus et al., 2018). La recolección de agua de lluvia se ha vuelto muy importante en muchas comunidades de Arizona, hasta el punto de que municipios en Tucson, han comenzado a ofrecer incentivos fiscales y programas de reembolso (Ciudad de Tucson, s.f.) para propietarios de viviendas y empresas que instalan sistemas de recolección (Radonic, 2019). Los sistemas de RHRW mejoran la disponibilidad de agua para diversos usos, como la jardinería, el riego de espacios verdes y plantas de sombra, el riego de cultivos, el llenado de piscinas y la producción ganadera (Mbilinyi et al., 2005).

Publication
Authors
Said Attalah
Peter Waller
Douglas Hunsaker
Charles Sanchez
Shaddy Alshraah
Kelly Thorp
Clinton Williams
Elsayed Ahmed Elsadek
Publication Date: April 2025 | Publication Number: az2123 | View PDF

Over a century ago, U.S. reclamation policy aimed to develop the West by providing water supplies for agriculture and other purposes (Hrozencik, 2021); however, agroecosystems in the U.S. Southwest are now vulnerable to water limitations due to the ongoing drought in the Colorado River basin, depletion of groundwater storage and reservoir water supplies, and increased distribution of water for industrial and municipal needs (Bennett et al., 2021; Castle et al., 2016).

In Arizona, approximately 72% of the state’s water supply is allocated to agriculture, with surface irrigation remaining the predominant method compared to pressurized systems (Pullen, 2023). This is mainly due to the existing infrastructure for conveying irrigation water from the Colorado River to farmers through irrigation canals (Elshikha et al., 2024). Reduced water allocations mandated for most of the water districts in Arizona due to the severe drought in the U.S. Southwest impose substantial challenges for growers in the state. Therefore, improvements in irrigation practices, systems, and management strategies are leading solutions for enhancing water productivity (WP) both in Arizona and around the world (Howell, 2001; Pereira et al., 2002). Additionally, climate change trends in the Desert Southwest (includes the arid and semi-arid desert landscapes in Arizona, California, Nevada, New Mexico, and Texas) further accelerates the inevitable risk of water shortage (Elsadek et al., 2024).

Adopting deficit irrigation strategies in arid and semi-arid regions according to crop growth stages and their sensitivity to water stress can improve on-farm management practices by reducing irrigation water use, decreasing evaporation losses, minimizing energy consumption, and increasing economic returns from investment in irrigation water supplies (Elsadek et al., 2023; Ragab, 2014). Moreover, improving soil quality by precisely estimating the salt leaching fraction (LF) and applying soil amendments and ameliorants as appropriate could enhance soil structure and increase water retention, leading to increased crop yield (Y). Additionally, soil amendments could reduce nutrient leaching by improving soil structure and increasing water retention, thereby promoting soil fertility (Zhang et al., 2023).

With recent advancements in pressurized irrigation systems, such as drip and center pivot, the importance of evaluating their performance has increased. This experiment compares the performance of three irrigation systems: flood, subsurface drip, and center pivot overhead sprinkler under varying irrigation rates and soil amendment application in a broccoli field. By assessing the effectiveness of each system, this research aims to provide Arizona growers with valuable information for optimizing irrigation practices to improve water-use efficiency and sustain crop yields.

Broccoli and irrigation scheduling

Broccoli (Brassica oleracea var. italica) is a cold-season vegetable closely related to the cauliflower and cabbage family (Patra et al., 2022). It is a shallow-rooted crop vulnerable to moisture and nutrient deficiency, thus, it requires frequent irrigation and fertilizer applications to ensure maximum crop production (Rajput et al., 2024).

Appropriate irrigation management is considered the most critical factor affecting broccoli quality and yield. In contrast, over-irrigation leads to leaching nutrients through deep percolation below the root zone, leading to reduced plant growth and yield. Meanwhile, under- irrigation causes water stress and yield reduction (Sakr et al., 2021). Therefore, there is an urgent necessity to optimize irrigation scheduling for broccoli, especially in water-limited regions, such as Arizona in the U.S. Desert Southwest.

Field trial and data analysis

A broccoli irrigation experiment was conducted at the University of Arizona Maricopa Agriculture Center in a 15-acre field equipped with three irrigation systems: flood (F), subsurface drip (D), and center pivot (CP). Two irrigation rates were evaluated for each irrigation system: 100% and 80% of crop evapotranspiration (ETc), applied to both amended (a) and non-amended soil. The study was carried out during the 2024 growing season using a planned experimental design with three replicate plots (R1, R2, and R3), Figure 1. Due to the water applied before the initiation of the variable rate, 80% ETc treatment became equivalent to 85% of ETc.

A total of five soil samples were randomly collected, with each sample consisting of six individual soil cores taken at 0.30-meter intervals, covering a total soil profile depth of 1.80 meters. The samples were mixed to form a single composite sample. Similarly, three water samples were combined to create a representative water sample. The salt leaching fraction (LF, %) was then determined through laboratory analysis using Equation 1 as follows (Ayers and Westcot, 1985):

Image
LF=(ECw/ECsw)*100

(1) where ECw is the salinity of the applied irrigation water and ECsw is the salinity of soil water.

Image
drip, center pivot and flood irrigation layouts

Figure 1. Field layout illustrating the flood (F), subsurface drip (D), and center pivot (CP) replicates (R) under different irrigation rates (100% and 80% crop evapotranspiration) with amended (a) and non-amended soil.

Liquid Natural Clay (LNC), a commercial soil amendment composed primarily of processed natural clay minerals (https://desertcontrol.com/, last accessed on March 31, 2025), was prepared on-site using the available irrigation water from the study location to maintain consistency with local water properties. It was applied to four experimental blocks, each measuring about 98 × 98 feet (Figure 1). Three blocks were included in the drip and flood irrigated plots, and the fourth block was under the center pivot. The LNC product, made by Desert Control  Americas, Inc. was applied using an overhead sprinkler system equipped with impact sprinklers. The application was conducted after bed formation and prior to planting. Minimal soil cultivation, 4” deep, was performed in treated blocks immediately before planting and again approximately two weeks after application to facilitate LNC integration while preserving soil structure.

Broccoli was planted on October 01, 2024, and harvested by the end of January 2025. At the beginning of the broccoli season, a solid set sprinkler system was used to irrigate flood and drip plots until October 25, 2024. Once plants were established, varying irrigation rates were applied using flood irrigation (starting Nov. 8, 2024), drip irrigation (starting Nov. 14, 2024), and center pivot irrigation (starting Nov. 21, 2024) until the end of the growing season.

To investigate the effects of irrigation systems, water deficit stress, and soil amendments on the processes involved in photosynthesis during the reproductive growth stage, we conducted single-point survey measurements of gas exchange between 12:00 PM and 2:00 PM. These measurements were taken from the uppermost, fully expanded leaf using the LI-6800 portable photosynthesis system (LI-COR, Lincoln, NE). Among several gas exchange measurements, we focused on two important physiological characteristics of broccoli: net photosynthesis and stomatal conductance. Stomatal conductance describes the exchange of carbon dioxide and water vapor through plant stomata and typically correlates well with water-use efficiency. Net photosynthesis, on the other hand, is the process that converts solar energy into glucose for growth and development. Stomatal conductance and net photosynthesis were measured at the maturity stage using the LI-6800 portable photosynthesis system to determine the rate at which a plant converts carbon dioxide to glucose across treatments.

Broccoli heads were harvested on January 15, 18, and 26 in 2025 for flood, drip, and center pivot, respectively. The water productivity (WP, t/ac-in) was estimated using Equation 2 (Molden et al., 2010):

Image
equation: WP=Y/TWA

(2) where TWA is the total water applied (irrigation and precipitation) during the growing season.

Findings

Total water applied

The average total water applied (TWA) varied between 19.7 inches (F100) and 13.3 inches (D80a), as shown in Figure 2 and listed in Table 1. This amount was higher than Sanchez et al. (2023), who reported 17.9 inches for broccoli cultivated under sprinkler and furrow irrigation in Yuma, Arizona. This difference was primarily caused by the higher salinity in our field, resulting in the application of 24.5% more water to leach the salt compared with 2.8% more water in the Yuma field.

Image
graph
Image
graph
Image
graph

Figure 2. Cumulative irrigation and precipitation events for flood – F (a), subsurface drip – D (b), and center pivot – CP (c), under different irrigation rates (100% and 80% of crop evapotranspiration). Based on the salinity of the applied irrigation water (ECw) and the salinity of soil water (ECsw), the leaching fraction was 24.5%.

Yield and water productivity

The findings from this field experiment, including Yield (Y, t/ac), water productivity (WP, t/ac-in), TWA (in), leaching fraction (LF, in), and percentage changes in Y and TWA, compared to F100, during the broccoli growing season, are summarized in Table 2. Yields in this preliminary trial ranged from 7.2 t/ac under the CP100 treatment to 9.3 t/ac under the D100a treatment, with the latter saving approximately 19.8% of irrigation water compared to the F100. Further water savings were observed with the D80a treatment, which reduced water use by 32.5% relative to flood irrigation (F100) while maintaining a yield of 9.1 t/ac. Remarkably, subsurface drip irrigation demonstrated reasonable performance under deficit irrigation, achieving a 32.5% reduction in irrigation water compared to flood irrigation at 100% of the calculated ETc. A WP of 0.36 t/ac-in was observed with the F100 treatment, compared to 0.68 t/ac-in with the D80a treatment, aligning with previous studies by Elshikha et al. (2023), Ragab (2014), and Elsadek et al. (2023), which highlight the benefits of deficit irrigation in arid regions. While center pivot irrigation also contributed to water conservation, achieving similar savings as subsurface drip, its yield benefits were only evident under deficit irrigation when soil amendments were applied (CP80a). Overall, the performance of subsurface drip irrigation indicates its potential as a sustainable irrigation system for regions with limited water resources. Although the soil amendment was not applied to the entire plot to directly evaluate water savings, it resulted in a 5.8-14.4% increase in yield when the F80 treatment was excluded.

Table1. Summary of the irrigation and yield data during the broccoli growing season at the University of Arizona Maricopa Agriculture Center, Arizona.

System

Flood (F)

Subsurface drip (D)

Center pivot (CP)

Treatment

F100

R100a

F80

F80a

F100

R100a

F80

F80a

F100

R100a

F80

F80a

TWA, in

19.7

16.8

15.8

13.3

16.4

14.0

LF, in

4.8

4.1

3.9

3.3

4.0

3.4

Y, t/ac

7.80

8.40

8.50

7.90

8.50

9.30

8.60

9.10

7.20

8.00

7.60

8.70

%change in TWA compared to F100

0

-14.9

-19.8

-32.5

-16.6

-29.1

% change in Y compared to F100

0

7.7

9

1.3

9

19.2

10.3

16.7

-7.7

2.6

-2.6

11.5

WP,t/ac-in

0.4

0.43

0.51

0.47

0.54

0.59

0.65

0.68

0.44

0.49

0.54

0.62

Note: TWA, LF, Y, and WP refer to total water applied, leaching fraction, yield, and water productivity, respectively. The letter "a" added to the abbreviation of the irrigation treatment denotes the soil amendment. The leaching fraction (LF) for our field was 24.5% based on the salinity of the applied irrigation water (ECw) and the salinity of soil water (ECsw).

Impact of irrigation and soil amendment on plant physiology 

Pressurized systems, drip and center pivot overhead sprinklers, may have enhanced the exchange of carbon dioxide and water compared to the flood. Furthermore, net photosynthesis tended to be higher with center pivot and subsurface drip irrigation compared to flood irrigation (Figure 3). Additionally, the LNC soil amendment enhanced stomatal conductance and net photosynthesis under all the tested systems, which might have contributed to the higher water productivity, especially at 80% ETc irrigation rate.

Image
Variations in net photosynthesis and stomatal conductance at maturity under different irrigation methods

Figure 3. Variations in net photosynthesis and stomatal conductance at maturity under different irrigation methods: flood (F), subsurface drip (D), and center pivot (CP), and irrigation rates (100% and 80% of crop evapotranspiration) with amended (a) and non-amended soil.

Recommendations

The evaluation of three irrigation methods, flood, subsurface drip, and center pivot, at varying irrigation rates and soil conditions indicated that subsurface drip irrigation, combined with soil amendments, resulted in the highest yield and water productivity (Table 1). The 100% subsurface drip treatment, with 100% replacement of calculated ETc, and the 80% drip treatment had yields of 9.3 and 9.1 t/ac, respectively, and they required water application depths of 15.8 and 13.1 inches, which resulted in water productivities of 0.59 and 0.68 t/ac-in. The flood and center pivot irrigated treatments had significantly lower yields and water productivities. These findings suggest that using subsurface drip irrigation at reduced application rates with soil amendments can maximize broccoli yields and water productivity. However, the long-term effects of the soil amendment need further investigation.

Salinity issues may potentially arise when using pressurized irrigation systems. High water salinity, particularly with sprinkler systems, may stress plants, especially during establishment, and contribute to salt buildup in the soil. For drip irrigation, leaching salt below the root zone and continuous monitoring of system performance are important to minimize salinity issues. Also, scheduled maintenance of irrigation systems is essential to avoid unplanned repairs and ensure system reliability.

Flood irrigation can be efficient when water is applied at an appropriate flow rate, which is influenced by factors such as furrow dimensions, field length, soil type, and slope. In our field, optimal efficiency was achieved by irrigating at flow rates exceeding 25 gallons per minute (GPM) per furrow. To maintain consistent flow, we utilized a trash pump and gated pipes. However, achieving this level of control may not be feasible on a typical farm due to variations in ditch flow rate and field conditions.

Acknowledgement

This work was supported by the University of Arizona Cooperative Extension Water Irrigation Efficiency Program, which is funded by the Arizona State Legislature.

Disclaimer

This publication provides an objective summary of an irrigation experiment and does not endorse or promote any particular brand, product, or trademark. Any references to product names, trademarks, or companies are included for informational purposes only.

References

  • Ayers, R.S., Westcot, D.W., 1985. Water quality for agriculture. FAO, Rome, Italy.
  •  Bennett, K.E., Talsma, C., Boero, R., 2021. Concurrent Changes in Extreme Hydroclimate Events in the Colorado River Basin. Water 13. https://doi.org/10.3390/w13070978 
  • Castle, S.L., Reager, J.T., Thomas, B.F., Purdy, A.J., Lo, M.- H., Famiglietti, J.S., Tang, Q., 2016. Remote detection of water management impacts on evapotranspiration in the Colorado River Basin. Geophys. Res. Lett. 43, 5089–5097. https://doi.org/10.1002/2016GL068675
  • Elsadek, E., Zhang, K., Mousa, A., Ezaz, G.T., Tola, T.L., Shaghaleh, H., Hamad, A.A.A., Alhaj Hamoud, Y., 2023. Study on the In-Field Water Balance of Direct- Seeded Rice with Various Irrigation Regimes under Arid Climatic Conditions in Egypt Using the AquaCrop Model. Agronomy 13, 609. https://doi.org/10.3390/ agronomy13020609
  • Elsadek, E.A., Zhang, K., Hamoud, Y.A., Mousa, A., Awad, A., Abdallah, M., Shaghaleh, H., Hamad, A.A.A., Jamil, M.T., Elbeltagi, A., 2024. Impacts of climate change on rice yields in the Nile River Delta of Egypt: A large- scale projection analysis based on CMIP6. Agric. Water Manag. 292, 108673. https://doi.org/10.1016/j.agwat.2024.108673
  • Elshikha, D.E., Attalah, S., Elsadek, E.A., Waller, P., Thorp, K., Sanyal, D., Bautista, E., Norton, R., Hunsaker, D., Williams, C., Wall, G., Barnes, E., Orr, E., 2024. The Impact of Gravity Drip and Flood Irrigation on Development, Water Productivity, and Fiber Yield of Cotton in Semi-Arid Conditions of Arizona, in: 2024 Anaheim, California July 28-31, 2024. American Society of Agricultural and Biological Engineers, St. Joseph, MI, pp. 1–16. https://doi.org/10.13031/aim.202400004
  • Elshikha, D.E.M., Wang, G., Waller, P.M., Hunsaker, D.J., Dierig, D., Thorp, K.R., Thompson, A., Katterman, M.E., Herritt, M.T., Bautista, E., Ray, D.T., Wall, G.W., 2023. Guayule growth and yield responses to deficit irrigation strategies in the U.S. desert. Agric. Water Manag. 277, 108093. https://doi.org/10.1016/j.agwat.2022.108093
  • Howell, T.A., 2001. Enhancing Water Use Efficiency in Irrigated Agriculture. Agron. J. 93, 281–289. https://doi.org/10.2134/agronj2001.932281x
  • Hrozencik, R.A., 2021. Trends in US irrigated agriculture: increasing resilience under water supply scarcity [WWW Document]. URL https://ssrn.com/abstract=3996325 or http://dx.doi.org/10.2139/ssrn.3996325 (accessed 2.27.25).
  • Molden, D., Oweis, T., Steduto, P., Bindraban, P., Hanjra, M.A., Kijne, J., 2010. Improving agricultural water productivity: Between optimism and caution. Agric. Water Manag. 97, 528–535. https://doi.org/10.1016/j.agwat.2009.03.023
  • Pereira, L.S., Oweis, T., Zairi, A., 2002. Irrigation management under water scarcity. Agric. Water Manag. 57, 175–206. https://doi.org/10.1016/S0378-3774(02)00075-6
  • Pullen, J., 2023. Water Use by Sector Tucson, Arizona MSA [WWW Document]. URL https://mapazdashboard.arizona.edu/article/arizonas-water-use-sector (accessed 3.2.25).
  • Ragab, R., 2014. A note on water use efficiency and water productivity. Water4Crops 1–11.
  • Rajput, J., Singh, M., Lal, K., Khanna, M., Sarangi, A., Mukherjee, J., Singh, S., Dimple, 2024. Development of single and dual crop coefficients for drip-irrigated broccoli using weighing type field lysimeters in semi- arid environment. Environ. Dev. Sustain. https://doi.org/10.1007/s10668-024-05416-5
  • Sakr, M.T., Ibrahim, H.M., ElAwady, A.E., AboELMakarm, A.A., 2021. Growth, yield and biochemical constituents as well as post-harvest quality of water-stressed broccoli (Brassica oleraceae L. var. italica) as affected by certain biomodulators. Sci. Hortic. (Amsterdam). 275, 109605. https://doi.org/10.1016/j. scienta.2020.109605
  • Sanchez, C., French, A., Anderson, R., Hunsaker, D., Saber, M., Subramani, J., William, C., Wisniewski, E., Zerihun, D., 2023. Quantitative Assessments of Water and Salt Balance for Cropping Systems in the Lower Colorado River Region. The University fo Arizona Yuma Center of Excellence for Desert Agriculture (https://www.desertagsolutions.org, last accessed on March 10, 2025).
  • Zhang, C., Zhao, X., Liang, A., Li, Y., Song, Q., Li, X., Li, D., Hou, N., 2023. Insight into the soil aggregate- mediated restoration mechanism of degraded black soil via biochar addition: Emphasizing the driving role of core microbial communities and nutrient cycling. Environ. Res. 228, 115895. https://doi.org/10.1016/j.envres.2023.115895
Publication
Publication Date: 2025

University of Arizona Cooperative Extension developed a bilingual text message database designed for practitioners, educators, and facilitators to support parent skill-building and child development classes at the Family Resource Centers in Santa Cruz County. These text messages are designed as reinforcement tools for key concepts taught in the classes and to help improve attendance and retention.

If you are leading classes for parents with children from birth to age five in either English or Spanish, these text messages can be added to your program to improve attendance and learning beyond the classroom.

Get Access


Database content

The database is available as an Excel spreadsheet with three tabs; instructions, text messages and class descriptions.

Instructions tab

Outlines how to navigate the spreadsheet and use text messages with participants.

Text messages tab

Structured messages in English and Spanish for eight different classes. Welcome and wrap-up messages are optional. 

  • Welcome Message - sent before the first session to introduce parents and caregivers to the class.
  • Reinforcement Messages - sent after each session to bridge communication between participants and their instructor, reinforce key concepts from the session, and encourage families to use what they learned during the session.   
  • Wrap-up Message - sent after the final session to summarize key takeaways and provide a sense of closure.  

Class descriptions tab

Names and descriptions of classes text messages were written for. Instructors can use the messages when teaching the classes they were written for or they can use the messages for different classes that teach similar content. 

Parent skill-building classes 
  • Abriendo Puertas - builds caregiver leadership skills and family well-being.
  • Positive Discipline - helps caregivers decode child behavior and turn problems into solutions for the long term. 
  • Power of Parenting - increases knowledge of brain development and the role parents play in promoting it.
Early childhood development classes
  • Partners in Parenting Education (PIPE) 1 and 2 - improves the relationship between caregivers and their children through shared positive emotions. 
  • Play & Learn - uses play to help toddlers learn.
  • Fine Arts for Threes - promotes child development through art-based activities. 
  • Keys for Threes - instills children with Ellen Galinsky’s seven essential life skills.
  • Kindergarten Readiness - helps children acquire kindergarten skills in five domains.

Benefits

Incorporating text messages into programs for parents of young children has been linked to:

Publication
Publication Date: October 2024

Roof rats are a common problem in Arizona.

Image
Photo of a roof rat

Non-native roof rats are an inescapable problem for many urban homeowners in Arizona.

Kilessan

Like their native cousins, pack rats, these non-native urban dwellers will move into your home, scurrying around inside walls and under floors – and, yes, on roofs - leaving behind property damage and potentially harmful droppings and hair. But there are steps you can take to keep them at bay.

The first step is identifying the enemy.

Roof rats - aka Rattus rattus, black rats, sewer rats or ship rats - are slender, dark-brown to black rodents with scaly tails almost always longer than their bodies. Adults measure about 5-7 inches, 12 inches including the tail. Their bodies are mostly covered with untidy fur with a lighter underside. They have pointed muzzles, large black eyes, large, almost hairless ears and hairless tails.

They move on all four legs but can stand on their two hind feet. They are agile runners and climbers and can easily climb trees and other rough, vertical surfaces. They’ve been known to run along overhead utility lines using their tails for balance. Roof rats can squeeze through openings as small as a dime. Adult roof rats can be confused with brown/Norway rats, which are also non-native, and young ones with house mice.

Check for Signs of Seldom Seen Visitors

Image
Graphic about roof rat droppings

U.S. Department of Health, Education and Welfare

Roof rats are seldom seen during the day and tend to avoid light. But they leave signs such as tracks, chew/gnaw marks, oily rub marks, droppings and urine, hair and chewed up paper, cloth or wood. Signs of rat activity include:

  • Droppings. Rodent droppings are elongated, with tapered ends.
  • Rub marks left by skin oils. All rodents leave these marks.
  • Sounds. Rodents can make noises in attics and walls.
  • Chewed or gnawed items. Rats leave behind chewed fruit, nuts, wiring, insulation and other items.


What You Can Do

Some homeowners take drastic measures like severe pruning or plant or tree removal to avoid providing habitat, food or water. But you can manage these pests effectively and still have beautiful landscaping.

Homeowners often ask Cooperative Extension if fruit and nut trees encourage or support rodent pest populations. Research shows that roof rat population is not related to the availability of food plants, so removing trees or specific plants will not reduce rat populations or prevent new rats from coming. They feed on seeds, flowers, leaves and tree roots and bark, not just fruits and nuts. They also forage in and around buildings and dumpsters.

Good landscape management can help keep rodents away from defensible spaces.

  • Proper, timely pruning ensures that branches do not touch walls and roof lines, reducing access to attics, windows and wall voids.
  • Removal and prompt disposal of fallen fruits, nuts and seeds can make your yard less attractive. This discourages rodent activity, forcing them to go elsewhere for food.
  • Use of fruit inhibitors, such as ethephon, is an option to minimize fruit. Make sure to follow label directions. Application timing is important.

Other ways to control rats around your home:

  • Monitoring - Regular inspection for entry points and timely pest proofing is essential.
  • Removal - This is a health priority. Severe rodent infestations indoors can result in large amounts of droppings, urine, fallen hair and hoarded food.
  • Waste management - Dumpsters and trash cans are primary lures for rats. Lids should be kept closed, and dumpsters should be kept on concrete slab 50 feet from buildings, when possible. Steam clean trash containers at least twice annually.
  • Exclusion - Preventing rodents from gaining access to building interiors must be done with the above steps.

Some Takeaway Thoughts

  • Roof rats are well established in some Arizona neighborhoods.
  • In those areas, roof rats are a long-term reality. Unless there is an area-wide long-term eradication program, they are here to stay.
  • Use pest proofing to keep them out of buildings
  • Keep them away with good landscape and waste management.
Publication
Authors
Publication Date: February 2024 | Publication Number: AZ1673S-2024 Descargar desde el Repositorio del Campus de la UA

Las plantas crecen mejor en climas a los que están más adaptadas. Conocer la zona climática de una ubicación es uno de los factores para cultivar con éxito plantas al aire libre. Mientras que el suelo, el agua y la luz son críticos, las temperaturas bajas o altas pueden limitar el crecimiento de las plantas en una ubicación específica. Arizona es un estado grande que abarca 335 millas de este a oeste y 390 millas de norte a sur, con diversas zonas climáticas. El clima está influenciado por la elevación, que determina las temperaturas altas y bajas, y por la precipitación, que varía en todo el estado. La precipitación varía desde 3 pulgadas anuales en Yuma, en la esquina suroeste de Arizona, hasta más de 30 pulgadas en las áreas montañosas. El clima de Arizona se clasifica como árido o semiárido porque la evapotranspiración, la pérdida combinada de agua del suelo y las plantas en una ubicación, es mayor que la cantidad de lluvia que recibe el área.

Publication
Publication Date: April 2024 | Publication Number: AZ2076S-2024 Descargar desde el Repositorio del Campus de la UA

Introducción

La restauración ecológica basada en semillas es un enfoque utilizado para revegetar hábitats dañados y perturbados mediante la dispersión de semillas con la expectativa de que ocurra la germinación y las plantas se establezcan y prosperen. Aunque la restauración puede mejorar la salud y productividad de los paisajes al reactivar los servicios ecosistémicos tanto directa como indirectamente, lograr una restauración exitosa es difícil, especialmente en sistemas áridos (Copeland et al., 2018). La germinación es un cuello de botella bien conocido para el crecimiento de las plantas que impide una restauración exitosa (James et al., 2011). La información general sobre la probabilidad de germinación y los requisitos proporcionaría información crítica que los gestores necesitan para tomar decisiones sobre qué especies priorizar para la restauración. Evaluamos una serie de especies comúnmente utilizadas en la restauración y su germinación mediante pruebas básicas de laboratorio e invernadero. Las especies que evaluamos incluyeron las gramíneas Aristida purpurea (purple three awn), Bouteloua gracilis (blue grama), Bouteloua rothrockii (six-weeks grama), Elymus elymoides (squirreltail), Pascopyrum smithii (western wheatgrass), Poa secunda (Sandberg bluegrass) y Vulpia octoflora (six-weeks fescue); y las hierbas/arbustos Atriplex canescens (four- wing saltbush), Baileya multiradiata (desert marigold), Dalea candida (white prairie clover), Ericameria nauseosa (rubber rabbitbrush), Krascheninnikovia lanata (winterfat), Linum lewisii (prairie flax), Machaeranthera tanacetifolia (Tahoka daisy), Penstemon palmeri (Palmer’s penstemon), Plantago ovata (psyllium), Senna covesii (desert senna) y Sphaeralcea ambigua (desert globemallow). Las semillas se compraron a Granite Seed en la primavera del 2022 y se almacenaron a temperatura ambiente durante cinco meses, luego en almacenamiento frío hasta que comenzaron las pruebas de germinación en el invierno del 2023. Las semillas se sembraron en macetas en un invernadero en grupos de 20 de la misma especie. Recibieron luz solar y agua diariamente en condiciones de temperatura ambiente. Para las especies que mostraron una baja germinación en el invernadero y/o requisitos documentados (de nuestro trabajo anterior) o sospechados de latencia (por ejemplo, Atriplex canescens, Baileya multiradiata, Bouteloua rothrockii, Penstemon palmeri, Senna covesii y Sphaeralcea ambigua), también evaluamos el efecto de la escarificación (pasando cada semilla sobre papel de lija) y/o estratificación fría/ húmeda en la germinación (colocando las semillas en platos petri con papel de filtro húmedo en un refrigerador durante 40 días) (Dunn, 2011). El experimento se llevó a cabo durante un solo mes.

Resultados

Todos los arbustos que evaluamos, Atriplex canescens, Ericameria nauseosa y Krascheninnikovia lanata; así como la gramínea Bouteloua rothrockii, y la hierba Senna covesii, mostraron una baja germinación (<25%). Las gramíneas Aristida purpurea, Bouteloua gracilis, Pascopyrum smithii, Poa secunda y Vulpia octoflora; y las hierbas Baileya multiradiata, Linum lewisii, Penstemon palmeri y Sphaeralcea ambigua demostraron una germinación moderada (25-70%). Finalmente, la gramínea Elymus elymoides y las hierbas Dalea candida, Machaeranthera tanacetifolia y Plantago ovata demostraron una alta germinación (>70%; Tabla 1). Los intentos de romper la latencia a través de la escarificación y/o la estratificación fría/húmeda no mejoraron la germinación para Atriplex canescens, Bouteloua rothrockii o Senna covesii, pero sí mejoraron la germinación para Baileya multiradiata, Penstemon palmeri y Sphaeralcea ambigua.

Tabla 1. Especies nativas comunes de restauración y su porcentaje de germinación. En la columna de dormancia probada, un "no" significa que las semillas se cultivaron en el invernadero, mientras que "estratificación" o "escarificación + estratificación" significa que las especies se estratificaron en condiciones frescas/húmedas y/o se escarificaron con papel de lija, con el fin de interrumpir la dormancia. Las gramíneas están marcadas en verde mientras que las hierbas/arbustos están marcadas en color negro. 

Especies
¿Fue probada la dormancia?
Porcentaje de germinación

Aristida purpurea (purple three awn)

No

40

Atriplex canescens (four-wing saltbush)

No

20

Atriplex canescens (four-wing saltbush)

Scarification + stratification

20

Baileya multiradiata (desert marigold)

No

5

Baileya multiradiata (desert marigold)

Stratification

25

Bouteloua gracilis (blue grama)

No

65

Bouteloua rothrockii (six-weeks grama)

No

0

Bouteloua rothrockii (six-weeks grama)

Stratification

0

Dalea candida (white prairie clover)

No

85

Elymus elymoides (squirreltail)

No

85

Ericameria nauseosa (rubber rabbitbrush)

No

0

Krascheninnikovia lanana (winterfat)

No

25

Linum lewisii (prairie flax)

No

60

Machaeranthera tanacetifolia (Tahoka daisy)

No

75

Pascopyrum smithii (western wheatgrass)

No

70

Penstemon palmeri (Palmer’s penstemon)

No

5

Penstemon palmeri (Palmer’s penstemon)

Stratification

30

Plantago ovata (psyllium)

No

75

Poa secunda (Sandberg bluegrass)

No

45

Senna covesii (desert senna)

No

10

Senna covesii (desert senna)

Scarification + stratification

0

Sphaeralcea ambigua (desert globemallow)

No

0

Sphaeralcea ambigua (desert globemallow)

Scarification + stratification

35

Vulpia octoflora (six-weeks fescue)

No

65

Advertencias

Aunque nuestro estudio destaca las especies que podrían proporcionar más utilidad para la restauración basada en su alta germinación, los gestionadores deben tener en cuenta que muchos factores pueden influir en las diferencias en la germinación. Estos incluyen la variedad, la calidad de la semilla, la presencia de una testa en las semillas, las condiciones de almacenamiento, la temperatura y la disponibilidad de humedad. Por ejemplo, las semillas en este estudio se almacenaron a temperatura ambiente durante cinco meses, y es posible que hayan tenido un porcentaje de germinación más alto si se hubieran mantenido en almacenamiento frío. Nuestros datos pueden servir como guía, pero siempre se recomienda realizar pruebas de germinación en lotes pequeños para las especies de restauración de interés. Dado que se encontraron diferencias significativas en la germinación entre semillas sin tratar y tratadas (por ejemplo, para interrumpir la dormancia), los cultivadores y los practicantes siempre deben explorar la utilidad de pretratar las semillas de alguna manera para mejorar la germinación. Las "Guías de plantas" del NRCS a menudo describen los requisitos de pretratamiento de las semillas para interrumpir la dormancia. Para obtener más información sobre restauración y como desarrollar una lista de plantas, visite Ecorestore.arizona.edu.

Referencias

  • Copeland SM, Munson SM, Pilliod DS, Welty JL, Bradford JB, Butterfield BJ (2018) Long-term trends in restoration and associated land treatments in the southwestern United States. Restoration Ecology 26: 311-322 
  • Dunn B (2011) Improved germination of two Sphaeralcea A. St.-Hil. (Malvaceae) species with scarification plus stratification treatments. Native Plants Journal 12: 13- 17 
  • James JJ, Svejcar TJ, Rinella MJ (2011) Demographic processes limiting seedling recruitment in arid grassland restoration. Journal of Applied Ecology 48: 961-969

Notes

El uso de nombres comerciales, de empresas o de productos se realiza únicamente con fines descriptivos y no implica respaldo por parte del Gobierno de los Estados Unidos.

Publication
Authors
Publication Date: April 2024 | Publication Number: AZ1996S-2024 Descargar desde el Repositorio del Campus de la UA

Integrar la restauración activa en un plan de tratamiento de especies invasoras mediante la siembra o plantación de especies nativas que puedan suprimir competitivamente a un invasor puede ayudar a mejorar los resultados del manejo de malezas. Esto ocurre porque las plantas nativas pueden tener rasgos (métodos de acceso a recursos) que se superponen con los invasores, restringiendo a estos últimos de aprovechar recursos como la luz y el espacio. Sin embargo, la eficacia de este enfoque suele estar modificada por la disponibilidad de agua. Esto se debe a que las plantas pueden responder a cambios en la disponibilidad de agua modificando rasgos, como la densidad y tamaño de las raíces (biomasa), afectando posteriormente la magnitud en la que pueden competir con los invasores (Potts et al., 2019). Identificar rasgos de especies nativas que sean competitivas contra especies invasoras en sistemas de tierras secas con disponibilidad variable de agua puede ayudar a mejorar los resultados del control de malezas.

Publication
Publication Date: April 2024 | Publication Number: AZ2063S-2024 Descargar desde el Repositorio del Campus de la UA

Los jardines proporcionan un entorno de aprendizaje práctico para involucrar a los niños pequeños. Si bien requieren cierta planificación y recursos para construir y mantener, incorporar actividades de jardinería en su aula o centro de educación infantil puede ser gratificante para los maestros y niños. A continuación, proporcionamos sugerencias para planificar un jardín, actividades de jardinería y cómo utilizar las actividades de jardinería para promover el aprendizaje y el desarrollo.

Publication
Authors
David Kopec
Kai Umeda
Publication Date: May 2024 | Publication Number: AZ1683S-2024 Descargar desde el Repositorio del Campus de la UA

En el desierto de baja altitud de Arizona, los céspedes de temporada cálida (césped bermuda, césped zoysia y césped San Agustín) entran en estado de dormancia y típicamente pierden su color verde durante el invierno. La sobresiembra de césped bermuda con un césped de temporada fría proporciona un césped verde durante todo el año. Un césped invernal sobresembrado proporciona un paisaje estético y funcionalmente ofrece un césped recreativo.