
The selection of the right crop varieties is a crucial decision for farmers, particularly in the production of small grains, including wheat, barley, and triticale in Arizona. There is significant diversity among small grain varieties, each showing different levels of adaptability and performance characteristics, ultimately influencing the profitability of farming operations. Variety performance can vary greatly from year to year, making it essential to conduct several site-year evaluations to characterize a variety's yield potential accurately. The purpose of this study is to assess nineteen commercially available small grain varieties (ALBERTO, APB709, BOPAK, Central Red, Central White, Desert Gold, Desert King, DORATO, KOPIUS, TIBURON, ISHI, Tehama, T298, T308, WB9215, WB9444, WB9623, WB9725, and XF9222) in terms of growth, development, yield, and other attributes. It is known that varieties respond differently to specific management practices and weather conditions. As part of an ongoing effort to evaluate productivity and characteristics, small grain varieties are being tested at the Maricopa Agricultural Center (MAC) in Maricopa, Arizona. Maricopa is located in low desert biome in the Sonoran Desert. This trial aims to assess the growth, physiology, yield, and quality characteristics of commercially available small grain varieties.
This preliminary report discusses the early to mid- season growth performance characteristics of nineteen commercially available varieties of durum wheat (Triticum durum), hard red wheat (Triticum aestivum L.), hard white wheat (Triticum turgidum), barley (Hordeum vulgare), and triticale (X Triticosecale Wittmack) for spring planting in the 2024/25 growing season.
Early-season growth characteristics
Wheat, barley, and triticale are the primary small grain crops cultivated in Arizona. Small grain crops are characterized by their relatively diminutive grain kernels or compact plant structure, which contrasts with crops such as corn or soybeans that possess larger kernels. Stand assessment, which entails determining and comparing the actual plant count in a field to the desired target population, is crucial for evaluating germination, emergence, and the overall health of the crops. When assessing emergence and making decisions regarding potential replanting events it is important to evaluate early season growth characteristics including the number of seedlings emerged, the uniformity of emergence and the potential yield loss from reduced emergence. This along with considering the time and costs associated with replanting, the reasons behind the original poor emergence, and the feasibility of addressing those reasons in the replanting process all need to be evaluated when facing a potential replant scenario (Ottman, 2015a). Choosing the right time to plant is important for getting good growth in small grain crops. The goal is to plant early enough to avoid hot weather later on, but not so early that the young plants get damaged by cold weather at the beginning of the season.
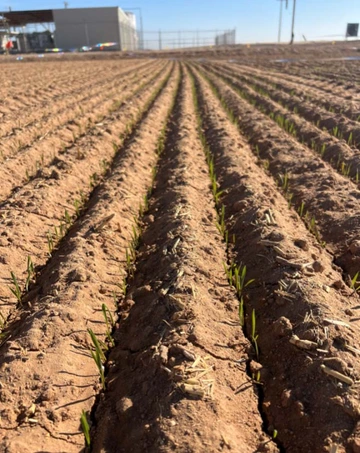
Figure 1. Durum wheat seedling emergence.
Emergence
Emergence is defined as the point when the initial leaf reaches half its total length. This first leaf is known as a seed leaf (cotyledon) and can be recognized by its rounded tip (Figure 1). Problems with seed emergence can happen if planting is not done correctly. This includes things like the wrong seeding rate, planting at the wrong time, not achieving optimum and unifrom plant spacing, planting too deep or too shallow, using the wrong equipment, or if the soil is not in good condition, for example, too dry, too cold, or having a crust on the surface. It can also be affected by how the land is tilled to prepare for planting and how it is irrigated after planting. Typically, around 75% of the planted seeds will emerge, although emergence rate can fluctuate between 50% and 100% based on soil and weather factors. It is recommended to plant seeds approximately 1 inch deep for small grains when planting into dry soil and then following with a water-up irrigation. Emergence issues may occur in areas of the field that receive either excessive or insufficient water from the initial post-plant irrigation. When planting in moist conditions, seeds should be placed beneath the dry mulch and either on or into the moist soil, at a depth of 1 to 2 inches. Emergence rates tend to be higher in soils that are warm at the time of planting and do not develop a crust. If soil crusting is impeding emergence, a light irrigation might be necessary. Using a grain drill enhances seeding precision in comparison to broadcasting. Seeding rate can differ among species of small grain crops and varieties within those species. Some varieties can achieve near-maximum yields across various seeding rates due to compensation among yield components. Varieties that have a high ability to tiller may adequately cover the soil surface at lower seeding rates, compensating for reduced plant density by producing more productive tillers. Conversely, some varieties may offset a lower plant density by developing a larger spike or bigger seed. Thus, stand establishment, which determines the density of plants that emerge and remain viable, is an accurate measure of seeding rate.
Stand establishment
Stand establishment is typically evaluated between the emergence and the two-leaf stage (Figure 2), and decisions regarding replanting need to be made during this period. Not all emerged plants will survive. Seedlings can be lost due to weeds outcompeting young plants for essential resources like sunlight, water, and nutrients, plant diseases, and plant-feeding insects, and other animals. Herbicide carryover may lead to the loss or damage of some seedlings. Additionally, bird damage can affect stand establishment, which may vary based on their feeding patterns along certain distances of seed rows. The ideal stand density for small grains ranges between 18-22 plants per square foot, depending upon crop type (Ottman, 2015b). Moreover, uniformity of the stand is one of the best indicators of whether the seeding rate is appropriate or if the stand is sufficient. Generally, a gap exceeding 12 inches is likely to lead to yield reduction and would therefore indicate poor stand uniformity, which an increased seeding rate may not compensate for (Figure 3).
Mid-season growth characteristics
During the mid-season growth phase of small grain crops, it is essential to recognize key characteristics such as stem elongation, tillering, booting, the emergence of the flag leaf, heading, and flowering (Figure 4). Understanding these stages not only enhances crop management but also optimizes yield potential. Tillers are additional shoots that arise from the base of the primary stem, with each one having the potential to produce a seed head, making them essential for optimizing yield potential. The tillering process starts around the 3-leaf stage and continues up until stem elongation. Favorable conditions for tillering include cool temperatures, moist soil, and a high nitrogen content in the soil. Between stem elongation and flowering, tillers may die off, with as many as half of them either perishing or failing to produce a grain head. After tillering, the stem begins to lengthen, a phase known as Jointing, during which nodes and internodes develop. The node 1 stage typically starts at the 5-6 leaf stage. This jointing period represents the fastest growth and the greatest increase in plant height. At the same time, the need for water and nutrients increases significantly during jointing. The final leaf on the stem, referred to as the flag leaf, usually starts to emerge from the whorl above the third or fourth node. The flag leaf completely emerges when the ligule of the flag leaf is visible. This leaf is vital for photosynthesis, accounting for about 75% of the leaf area that contributes to carbohydrate production for grain filling; thus, it is important to maintain its optimal area and monitor for diseases and pests to fully leverage its potential.
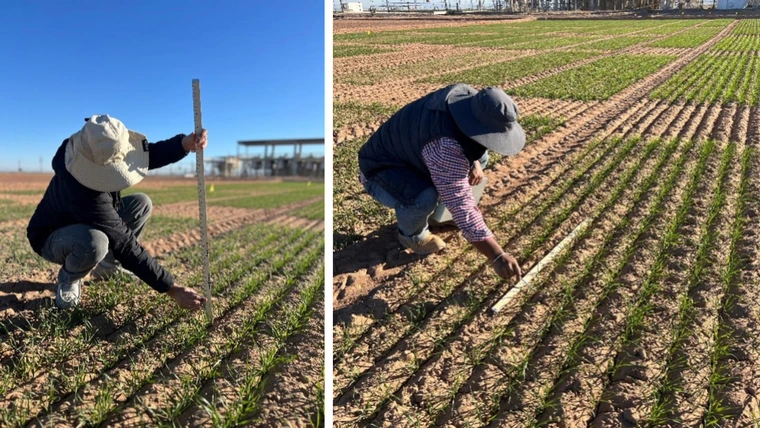
Figure 2. Plant height (left) and stand county (right) measurements for 19 commercially available small grain varieties.
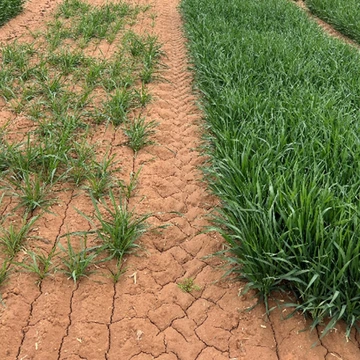
Figure 3. Examples of poor wheat stand density (left) and ideal wheat stand density (right).
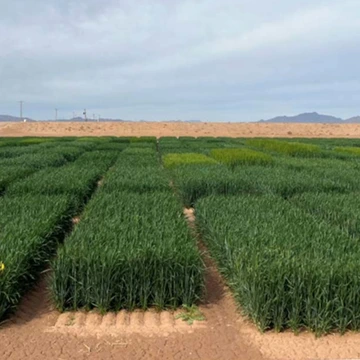
Figure 4. Mid-season growth for small grains.
Procedure and discussion
Wheat, barley, and triticale commercial cultivars were evaluated at Maricopa by the University of Arizona (UA) in 2024/25. The seed was planted using a cone planter in plots that were 20 feet long, arranged in ten rows spaced 6.5 inches apart. The seeding rate was approximately 100 pounds per acre. The field had been left fallow the previous year, and soil samples were collected at a depth of 6-12 inches across the field and were sent to Ward Laboratories, Inc. (https://www.wardlab.com/) for physical and chemical properties analysis (see Table 1). The soil test indicated that the soil texture was sandy loam and low in phosphorus and nitrogen. Estimated Nitrogen release was obtained with Haney Test method. Mono-ammonium phosphate (11-52-0) was applied pre-plant at a rate of 100 pounds of fertilizer per acre, providing 11 pounds of nitrogen per acre and 52 pounds of P2O5 per acre.
The experimental design used was a randomized complete block with four replications. Cultural practices during the early to mid-season are outlined in Table 2. The trial was initiated on December 10, 2024, followed by flooding and irrigation with 0.6-acre inches of water. Key measurements of small grain stands including time to 50% emergence, seedling population count, and seedling height were taken during plant establishment. The number of days until the first signs of seedling emergence (Table 3) were recorded for each variety starting from planting. Stand counts per square meter and plant heights were noted at the time of uniform and even seedling emergence.
Out of the nineteen varieties evaluated, Desert Gold and Desert King had the lowest emergence rates and stand counts and were consequently excluded from the later growth characteristic assessments. On average, the remaining seventeen varieties took about 13 days, or 164 heat units accumulated since planting (HUAP) (86/45) °F to uniformly and evenly emerge (Table 3). These HUAP values were obtained from the Arizona Meteorological Network (AZMET) - Maricopa Station and Heat Units were calculated used the Heat Accumulation Calculator (https://azmet.arizona.edu/application-areas/heat- units). The stand count recorded at the onset of tillering, which was about one-month post-planting or 338 HUAP (Table 3), varied by 15% among the varieties, with an average stand count of 20 plants per square foot, which is generally considered optimal for small grains.
All barley varieties exhibited faster growth rates compared to wheat and triticale, reaching the heading stage at 1060 HUAP (three months after planting), while wheat and triticale reached the flag-leaf stage at this time. The average number of nodes on the main stem was four at the flag-leaf stage, which is typical (Table 3).
It is important to note that trials conducted at agricultural experimental stations do not replace localized on-farm testing of new varieties. Multiple locations and years are required to assess variety performance accurately. The results from this trial are most valuable when combined with data from multiple years but serve here to provide preliminary observations.
Table 1. Soil chemical and physical properties for small grain variety trial at Maricopa Ag Center, 2024/25.
| Soil Properties | Unit | Value |
|---|---|---|
| Soil pH | pH | 8.4 |
| 1:1 Soluble Salts | mmho / cm | 0.45 |
| Organic Matter | % | 1.2 |
| Cation Exchange Capacity | meq / 100g | 23.25 |
| Soil Texture | Sandy Loam |
|
| Estimated Nitrogen Release | lb N / acre | 42 |
| NO3-N | ppm | 11.7 |
| P | ppm | 7.5 |
| K | ppm | 375 |
| S | ppm | 39 |
| Zn | ppm | 0.68 |
| Fe | ppm | 3 |
| Mn | ppm | 7.5 |
| Cu | ppm | 1.3 |
| Ca | ppm | 3947 |
| Mg | ppm | 203 |
| Na | ppm | 200 |
Table 2. Cultural practices for a small grains variety trial at the Maricopa Agricultural Center, 2024/25. Previous crop was fallow and date of planting was 12/10/2024.
Irrigation application | Date | Acre-Inches | Method |
|---|---|---|---|
| 12/10/2024 | 4.0 | Flood |
1/16/2025 | 4.0 | Flood | |
2/12/2025 | 4.0 | Flood | |
3/5/2025 | 4.0 | Flood | |
Nitrogen application | Date | Lbs. N/A | Type |
12/10/2024 | 11 | 11-52-0 | |
1/16/2025 | 50 | UAN 32 | |
2/12/2025 | 50 | UAN 32 | |
3/5/2025 | 50 | UAN 32 | |
Phosphorus application | Date | Lbs. N/A | Type |
12/10/2024 | 11 | 11-52-0 | |
Pesticides application | none |
Table 3. Early to mid-season growth characteristics for small grain variety trial at Maricopa Agricultural Center, 2024/25.
Company | Name | CLASS | Early season | Mid season | |||||
|
|
| Time to 50% emergence (days)
| Stand count (# plants / sq. feet)
| Plant height (inches) | Stage | Nodes (# nodes / main stem) | Plant height (inches) | |
APB | ALBERTO | Durum wheat | 13 | 16 | 5 | Flag leaf | 4 | 20 | |
APB | APB709 | Hard Red wheat | 13 | 28 | 4 | Flag leaf | 4 | 21 | |
APB | DORATO | Durum wheat | 13 | 23 | 5 | Flag leaf | 4 | 23 | |
APB | KOPIUS | Barley | 13 | 17 | 4 | Heading | 5 | 26 | |
APB | T298 | Triticale | 13 | 21 | 5 | Flag leaf | 4 | 25 | |
APB | T308 | Triticale | 13 | 19 | 5 | Flag leaf | 4 | 23 | |
APB | TIBURON | Durum wheat | 13 | 18 | 5 | Flag leaf | 5 | 23 | |
UC Davis | BOPAK | Triticale | 13 | 16 | 4 | Flag leaf | 5 | 26 | |
UC Davis | Central Red | Hard Red Wheat | 16 | 20 | 3 | Flag leaf | 4 | 18 | |
UC Davis | Central White | Hard White Wheat | 13 | 20 | 5 | Flag leaf | 5 | 23 | |
UC Davis | ISHI | Barley | 13 | 18 | 4 | Heading | 5 | 29 | |
UC Davis | Tehama | Barley | 13 | 18 | 4 | Heading | 5 | 33 | |
WESTBRED | WB9215 | Hard Red Wheat | 13 | 20 | 5 | Flag leaf | 4 | 21 | |
WESTBRED | WB9444 | Hard Red Wheat | 13 | 22 | 5 | Flag leaf | 4 | 22 | |
WESTBRED | WB9623 | Hard Red Wheat | 13 | 19 | 5 | Flag leaf | 4 | 22 | |
WESTBRED | WB9725 | Hard Red Wheat | 13 | 17 | 4 | Flag leaf | 3 | 18 | |
WESTBRED | XF9222 | Hard Red Wheat | 13 | 22 | 5 | Flag leaf | 4 | 25 | |
Mean | 13 | 20 | 4 | 4 | 23 | ||||
SD | 1 | 3 | 1 | 1 | 4 | ||||
CV (%) | 6 | 15 | 15 | 12 | 17 | ||||
Acknowledgements
We are grateful to the Arizona Grain Research and Promotion Council for partially funding this project and to the industry stakeholders for participating in this trial.
Disclaimer
Any products, services or organizations that are mentioned, shown or indirectly implied in this publication do not imply endorsement by The University of Arizona.
References
M. J. Ottman. 2015a. Small Grain Growth and Development. University of Arizona Cooperative Extension Publication AZ1346
M. J. Ottman. 2015b. Seeding Rates for Small Grains in Arizona. University of Arizona Cooperative Extension Publication AZ1334