
Estimating Crop Evapotranspiration Using Lettuce Crop Coefficients for Irrigation Scheduling in Yuma, Arizona
Declining freshwater quantity and quality in Yuma County, Arizona, poses complex challenges for sustainable agriculture. The region produces winter vegetables, including iceberg, Romaine, and other lettuces, as well as celery, cauliflower, broccoli, spinach, and cabbage. During summer months, the area produces cantaloupes, watermelons, honeydews, and other melons. Significantly nationally, Yuma County is a major producer of winter vegetables, providing a large share of the national supply of winter lettuce (Lactuca sativa L.) (Duval et al., 2024; Duval, 2023). High-quality water is essential for producing premium lettuce in Yuma; reductions in available freshwater directly affect both yield and quality (U.S. Bureau of Reclamation, 2022). These challenges are compounded by the need to manage not only water volume but also its salinity and nutrient content, which can fluctuate significantly under drought conditions.
In recent years, an acute shortage in the Colorado River has further threatened water supplies in the Yuma Valley. The salinity of irrigation water delivered to this region is often much higher than upstream, sometimes requiring as much as 20% of water to be applied as leaching to prevent salt buildup and protect crop productivity (Yuma Water Resources Research Center, 2024). These factors intensify the need for innovative, precise water management.
As water resources become increasingly limited, integrated approaches—such as utilizing crop coefficients to guide effective irrigation scheduling—represent a vital tool for optimizing irrigation management. These approaches ensure that the appropriate amount of water is delivered to the crop root zone at the right time and with sufficient uniformity to meet crop water requirements. This ultimately helps optimize productivity in the region. Some studies report that lettuce requires about 38 to 50 inches of water per acre to produce a desirable crop (University of Arizona Cooperative Extension,), while other recent studies report about 12 to 16 inches of water per acre (Sanchez et al., 2022). However, this can vary significantly depending on soil type, field slope, temperatures, and planting window. Additionally, the magnitude of the quantified differences in crop evapotranspiration–irrigation yield production functions, crop evapotranspiration, and crop water productivity for organic versus conventional Romaine lettuce production systems has not been sufficiently investigated in Yuma, AZ.
Site-specific irrigation management is especially important because local soil properties, microclimate conditions, and crop varieties can all influence water needs. Tailoring irrigation practices to the unique conditions of each field not only improves water use efficiency, but also helps prevent over- or under-irrigation, reduces nutrient loss, and supports sustainable crop production. Crop coefficient–based approaches are among the most practical and scientifically validated tools available to help address the irrigation challenges in Yuma’s dynamic environment.
Jump To:
- Role of evapotranspiration in irrigation management
- Types of evapotranspiration
- Understanding the crop coefficient (Kc)
- Adapting Kc values for different lettuce varieties
- Estimating crop evapotranspiration
- Measuring irrigation efficiency in crop production
- Additional sources for ET (ETref) data
- References
Role of evapotranspiration in irrigation management
Evapotranspiration (ET) is the process by which water moves from the Earth's surface into the atmosphere, and results from evaporation of water from soil and water surfaces and transpiration of water from plant leaves. It is the most significant component of the hydrological cycle and is one of the most critical variables in irrigation management, crop production, and the sustainability of agriculture. Daily ET rates are needed for effective irrigation management and scheduling. The ET rate is normally expressed in millimeters (mm) or inches (in) per unit of time (e.g., an hour, day, week, month, or even an entire growing period or year).
ET is the combination of two separate processes whereby water is lost on the one hand from the soil surface by evaporation and on the other hand from the crop by transpiration and is referred to as evapotranspiration (ET). Evaporation is the process whereby liquid water is converted to water vapor (vaporization) and removed from the evaporating surface. Water evaporates from a variety of surfaces, such as lakes, rivers, pavements, soils, and wet vegetation. Energy is required to change the state of the molecules of water from liquid to vapor. Direct solar radiation and, to a lesser extent, the ambient temperature of the air provide this energy. Transpiration consists of the vaporization of liquid water contained in plant tissues and the vapor removal to the atmosphere. Crops predominantly lose their water through stomata. These are small openings on plant leaves through which gases and water vapor pass.
Types of evapotranspiration
There are two types of evapotranspiration: reference evapotranspiration (ETref) and crop evapotranspiration (ETc).
Reference evapotranspiration (ETref)
There are two main types of ETref commonly used. The first, reference ETo, is defined as the evapotranspiration from a 3–6 inch tall, cool-season grass that completely covers the ground and is supplied with adequate water. ETo is commonly used in the eastern, southern, southeastern, and western United States (Allen et al., 1998; Food and Agriculture Organization of the United Nations, 2020). The second type, reference ETr, assumes a reference surface of tall grass or alfalfa (approximately 20 inches tall) that also completely covers the ground and is supplied with adequate water. ETr is more commonly used in the Midwest (Allen et al., 1998).
ETref is typically calculated using scientifically recognized models of the Penman-Monteith equation, which rely on local weather data, including temperature, humidity, wind speed, and solar radiation. In Arizona, growers can access accurate, site-specific ETo values from the Arizona Meteorological Network (AZMET), which provides daily, weekly, and seasonal data collected from automated weather stations across the state.
Crop evapotranspiration (ETc)
The second type is crop evapotranspiration (ETc), which refers to the actual water use or demand of a specific crop under specific field conditions.
Understanding the crop coefficient (Kc)
The crop coefficient (Kc) is a factor used to adjust reference evapotranspiration (ETref) to reflect the actual water use of a specific crop. Kc values are unique for each crop and vary throughout the growing season as the plant develops from initial establishment through mid-season and into maturity. These coefficients are typically determined through field research and experimental trials that measure how much water a crop uses at different growth stages under local conditions. For each stage, such as initial, crop development, mid-season, and late-season, there are corresponding Kc values that help producers better estimate of actual crop evapotranspiration (ETc) and, ultimately, schedule irrigation more accurately. Utilizing stage-specific Kc values in combination with ETref allows for a more precise estimation of crop water needs, reducing waste and promoting sustainable water management (Allen et al., 1998).
For lettuce production in Yuma, crop coefficient (Kc) values are essential for accurately estimating water needs at different growth stages. These Kc values have historically been determined through local field trials and are periodically updated to reflect changes in lettuce varieties, advances in agronomic practices, and improvements in irrigation management. With the introduction of new lettuce hybrids and seed varieties that may have different water use patterns, as well as shifts in production schedules and planting methods, the Kc values for lettuce have changed (i.e., increased or reduced) over time depending on the location. Additionally, climate change, shown through more frequent heat waves and extended drought periods, has influenced crop water use, requiring further refinement of Kc values to ensure they remain accurate and relevant for today’s growers for site-specific effective irrigation management. Using locally updated Kc values from Yuma helps producers finetune irrigation scheduling, optimize water use efficiency, and sustain high yields under changing environmental and management conditions.
The crop coefficient (Kc) values presented in this Extension article are the result of recent collaborative efforts, led by Drs. Sanchez (University of Arizona) and Andrew French (USDAARS) in partnership with the Yuma Center of Excellence for Desert Agriculture (YCEDA), to update and refine Kc measurements, ensuring they accurately represent current lettuce production practices in Yuma, AZ (Figure 1). This update was driven by the need to represent the prevailing agronomic practices followed by growers in the region, as well as the seed varieties, local climate, and soil conditions specific to Yuma, AZ. Incorporating these factors, the revised Kc values provide a more precise and practical tool for growers to schedule irrigation, better match water applications to crop demand, and support both water conservation and highquality lettuce yields. These values have been quantified and validated using advanced field measurements and Eddy Covariance technologies, as documented in the recent peerreviewed study by French et al. (2024). The growing season is divided into three phases (Figure 1): initial (0–16 days after planting), development (16–75 days after planting (DAP)), and mid-season (75–89 DAP), so that each Kc value the initial crop coefficient (Kc_ini), development coefficient interpolated (Kc_dev), and mid-season coefficient (Kc_mid) corresponds to a distinct growth stage (French et al., 2024). In Figure 1, Kc_ ini is 0.90, representing water use during early growth after planting. Kc_dev increases linearly from 0.90 to 1.19 through the development phase, reflecting rising water needs. Kc_mid is 1.19, corresponding to full canopy and peak water demand. Because romaine and iceberg varieties reach full canopy at different times, and those timings can shift with planting date, stage durations should be adjusted to match each cultivar’s specific growth timeline.
Adapting Kc values for different lettuce varieties
While the Kc values presented in this article are based on averages from multiple commercial sites in Yuma and reflect commonly grown varieties of lettuce, it is important to recognize that different types and new cultivars may have unique water use characteristics. Factors such as plant size, growth rate, canopy structure, and season length can all influence crop water use and, consequently, the appropriate Kc values. To adapt Kc values for specific lettuce varieties or unique field conditions, growers are encouraged to:
- Monitor crop development closely: Adjust irrigation timing as needed based on plant growth stage and local weather data. Regular field observations and growth monitoring can help ensure that water applications match the actual needs of the crop.
- Consult local experts: Seek updated recommendations from local Cooperative Extension offices.
- Utilize soil moisture sensors: This technology can assist in optimizing irrigation schedules by providing real time feedback on soil moisture status and crop water use.
- Refer to additional research and regional guidelines: Utilize resources from the University of Arizona Cooperative Extension or recent peer-reviewed studies for the most up-to-date recommendations and scientific findings
Considering these approaches and resources, growers can better adapt Kc values to their specific lettuce varieties and field conditions, thereby optimizing water use efficiency and supporting sustainable lettuce production in the region.
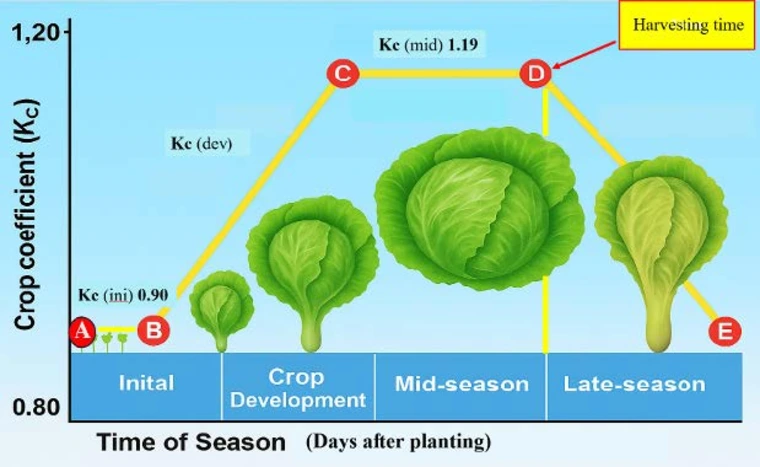
Figure 1. Illustration of average crop coefficient (Kc) values for lettuce grown in Yuma, Arizona, based on data from 12 commercial sites. Kc_ini (0.90) corresponds to the initial stage; Kc_dev increases linearly from Kc_ini (0.90) to Kc_mid (1.19) during the crop development phase; and Kc_mid (1.19) represents the mid-season (full canopy) stage.
Estimating crop evapotranspiration
To ensure adequate crop water use and maintain soil moisture at optimal levels, it is essential to replenish the soil with the amount of water lost through evapotranspiration (ET) over a given period. A widely used method for estimating the actual crop evapotranspiration rate (ETc) involves first calculating the reference evapotranspiration (ETo) and then multiplying it by a crop-specific coefficient (Kc). This relationship can be expressed as:
ETc = ETo × Kc
This approach allows growers to tailor irrigation scheduling to the specific water requirements of their crops, helping to maximize efficiency and crop productivity.
Measuring irrigation efficiency in crop production
Irrigation efficiency is a measure of how effectively applied irrigation water is used by the crop. It is typically calculated as the ratio of the amount of water consumed by the crop (usually measured as crop evapotranspiration, ETc) to the total amount of water applied through irrigation. This can be expressed as:
Irrigation Efficiency (IE) (%) = (ETc) / (Total Irrigation Water Applied) × 100
Higher irrigation efficiency indicates that a greater proportion of applied water is being used productively by the crop, with less loss to runoff, deep percolation, or evaporation. Improving irrigation efficiency helps conserve water resources and can contribute to more sustainable crop production.
Example 1
A lettuce crop is grown in Yuma Valley and is at the Kc mid-season (Kc_mid) growth stage. The reference evapotranspiration (ETo) for the 7 days from January 1 to 7, 2025, is 0.76 inches. Determine the crop evapotranspiration (ETc) and the amount of irrigation needed to replenish the water lost since the last irrigation, assuming the irrigation method has 100% efficiency
Solution
Yuma growers can access daily reference evapotranspiration (ETo) estimates and other weather parameters through the Arizona Meteorological Network (AZMET).
How to access and obtain data
- Visit AZMET: The Arizona Meteorological Network (Figure 2a).
- Select the weather station nearest to your field, in this case, Yuma Valley (Figure 2a).
- Under Special Reports, click ETo, then select the dates for which you need to calculate ETo (Figure 2b).
- Use the values from the Penman-Monteith Cumulative column (Figure 3).
Given
ETo (January 1-7, 2025) = 0.76 inches (over 7 days) Crop stage: Kc mid-season (Kc_mid), Crop coefficient, Kc = 1.19 (from Figure 1) Irrigation efficiency = 100%
Calculation
Using the formula for crop evapotranspiration: ETc = Kc × ETo
Substitute the values ETc = 1.19 × 0.76 = 0.90 inches
Since the irrigation efficiency is 100%, the irrigation needed to replenish the lost water is equal to ETc
Irrigation needed = 0.90 inches
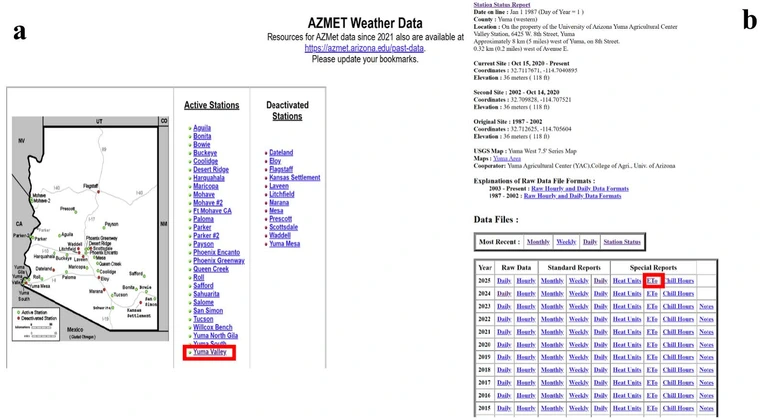
Figure 2: Access reference evapotranspiration (ETo) data on the Arizona Meteorological Network website. (a) Select the Yuma Valley weather station nearest to your field. (b) Navigating to Special Reports to select ETo and the desired dates.
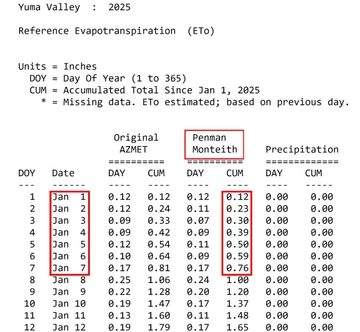
Figure 3: Extracting reference evapotranspiration (ETo) values from the Penman-Monteith Cumulative column for the period January 1 to January 7, 2025.
Example 2
Using the same ETc from Example 1, but assuming a furrow irrigation system was used to irrigate lettuce with 60 % efficiency, determine how much irrigation is the required irrigation.
Solution
Given
- Net Irrigation Requirement (NIR) = Crop evapotranspiration ETc = 0.90 inches
- Irrigation Efficiency (IE) = 60% = 0.60
Formula
Gross Irrigation Requirement (GIR) = NIR / IE
Calculation
Using the formula for crop evapotranspiration ETc = Kc × ETo
Substitute the values ETc = 1.19 × 0.76 = 0.90 inches
Since the irrigation efficiency is 100%, the irrigation needed to replenish the lost water is equal to ETc Irrigation needed = 0.90 inches
Additional sources for ET (ETref) data
Pan Evaporation
A standardized metal pan filled with water is placed in the field (Figure 4), and water loss through evaporation is measured over a specific period. Because evaporation from the pan typically occurs faster than from crops, a correction factor (pan coefficient) is applied to estimate ETref accurately. This method is practical for growers without direct access to weather station data like AZMET. However, if you have a weather station located near your field, using ETref values directly from that station will generally provide more accurate and representative data for your crop
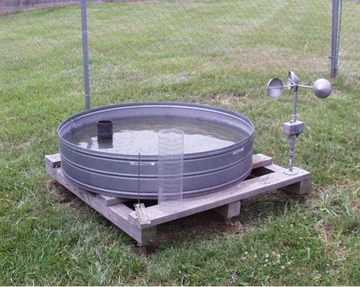
Figure 4: Standardized evaporation pan placed in the field to measure atmospheric evaporative demand.
ETgage
Another tool commonly used to estimate reference evapotranspiration (ETref) in the field is the ETgage® (ETG) (Figure 5). The ETgage functions as an atmometer, which simulates plant evapotranspiration by measuring the evaporation rate from a porous ceramic surface that mimics the properties of a reference crop, such as grass. The device is typically filled with distilled water and exposed to the same environmental conditions as the crop. As water evaporates from the ceramic surface, the loss is recorded and used to estimate ETref. This measurement provides growers with a practical and easy-to-read indicator of the atmospheric demand for water, making it a valuable tool for irrigation scheduling. The ETgage can be especially useful in areas where access to weather station data is limited, offering realtime, site-specific information about crop water needs.
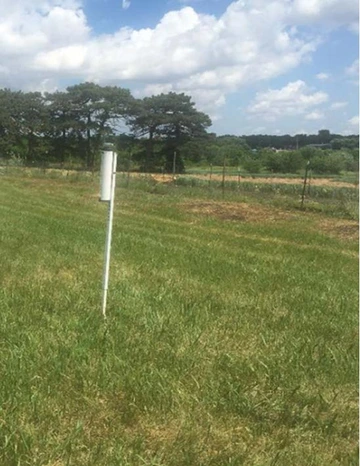
Figure 5: ETgage® atmometer placed in the field to estimate reference
evapotranspiration by measuring evaporation from a porous ceramic
surface
KB-ET Software
KB-ET is another useful resource for estimating reference evapotranspiration (ETref) (Figure 6). This software application is designed to calculate ETref using local weather data and established scientific formulas, such as the Penman-Monteith equation. KB-ET allows users to input site-specific weather variables, like temperature, humidity, wind speed, and solar radiation, either manually or by importing data from local weather stations. The software then processes this information to generate daily, weekly, or seasonal ETref estimates tailored to local conditions. If data is already being imported from established networks like AZMET, it generally makes sense to directly use the ETref provided by AZMET. However, KBET Software is particularly beneficial when local or privately operated weather stations exist near the crop fields, as this allows growers to calculate highly representative, site-specific ETref values.
FAO ETo Calculator
FAO ETo Calculator is is a free software tool (https://www. fao.org/land-water/databases-and-software/eto-calculator/ en/) provided by the Food and Agriculture Organization (FAO) of the United Nations to estimate reference evapotranspiration (ETo). The calculator uses the Penman- Monteith method, which is internationally recognized for its accuracy in determining ETo. Users can input daily or monthly weather data, such as temperature, humidity, wind speed, and solar radiation, to obtain reliable ETo estimates for a specific location and period. This tool is especially helpful for growers and water managers who need a straightforward way to generate ETo values for irrigation scheduling, especially in areas where direct weather station data may not be readily available (Food and Agriculture Organization of the United Nations, 2020).
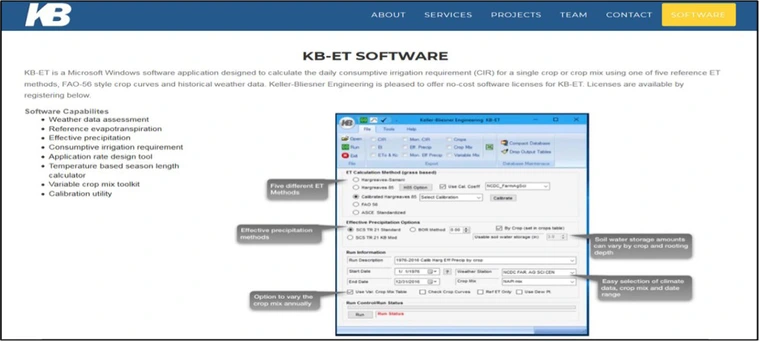
Figure 6: Screenshot of the KB-ET Software interface used for estimating reference evapotranspiration from local weather data.
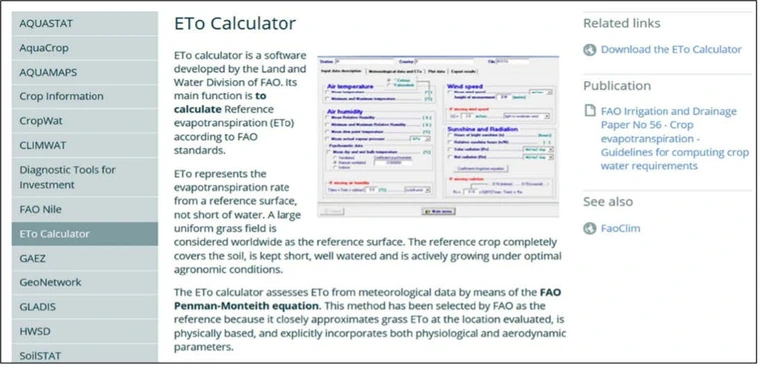
Figure 7: Screenshot of the FAO ETo Calculator interface, a free tool for estimating reference evapotranspiration using the Penman-Monteith method.
References
Allen, R. G., Pereira, L. S., Raes, D., & Smith, M. (1998). Crop evapotranspiration: Guidelines for computing crop water requirements (FAO Irrigation and Drainage Paper No. 56). Food and Agriculture Organization of the United Nations. https://www.fao.org/3/x0490e/x0490e00.htm
Arizona Meteorological Network (AZMET). (n.d.). The University of Arizona Cooperative Extension Publication. https://cals.arizona.edu/azmet/
Department of Agriculture. (n.d.). Development of an iceberg lettuce irrigation-salinity management app. Retrieved July 10, 2025, from https://agriculture.az.gov/sites/default/files/documents/Development%20of%20an%20Iceberg%20Lettuce%20Irrigation-Salinity%20Management%20App.pdf
Duval, D. (2023). Arizona’s seasonal role in national supply of vegetable & melon specialty crops (Publication No. AZ2064). University of Arizona Cooperative Extension. http://hdl.handle.net/10150/671213
Duval, D., Montanía, C., Frisvold, G., & Quintero, J. (2025). Economic contribution of Yuma County agriculture report. University of Arizona Extension. https://extension.arizona.edu/sites/default/files/2025-02/Economic-Contribution-of-Yuma-County-Agriculture-Report.pdf
Sanchez, C. A., French, A. N., Hunsaker, D. J., Bronson, K. F., & Saber, M. N. (2022, February). Development of an iceberg lettuce irrigation-salinity management app (Technical Report). Arizona.
U.S. Bureau of Reclamation. (2022). Colorado River Basin: Water supply and drought status. https://www.usbr.gov/lc/region/g4000/riverops/crbst.htm
University of Arizona Cooperative Extension. (n.d.). Lettuce irrigation. Arizona Crop Information Site (ACIS). Retrieved July 6, 2025, from https://acis.cals.arizona.edu/agricultural-ipm/vegetables/lettuce/irrigation
Yuma Water Resources Research Center. (2024). Yuma water factsheet. https://wrrc.arizona.edu/sites/default/files/2024-01/Yuma_Factsheet_01_2024.pdf