
Using Drones for Management of Crops
A wide range of circumstances adversely affect crop growth and plant health. Crops are susceptible to disease (insects, fungus, etc.), improper levels of nutrients in the soil and availability of water, all of which impact a plant’s growth and yield.
Traditionally, growers monitor crops through scouting and analysis of plant growth and soil status. However, visual inspections are time consuming and depend on the observer’s skill at diagnosing potential problems. The chance of missing early signs of stress in small patches is high, and repeatability is limited due to inaccessibility of the entire field, especially during later growth stages; additionally, ground based field-of-view narrows as plants grow taller, limiting assessment. Scouting by sight and touch alone can have a low area of observation per time of scouting for large-scale farming operations. More precise early detection provides the grower with more options when the problem is known early on, resulting in a more timely defense translating to increased return on investment and peace of mind.
Unmanned aerial systems (UAS, also called drones) can perform many scouting tasks in real-time, utilizing a combination of thermal, multi-spectral, and red-blue-green (RGB) imaging systems. With suitable UAS and sensors, a grower is able to obtain useful information about their crop, helping them to identify when and where to irrigate, fertilize, or administer pest control measures.
Flying drones
Drones are flown without onboard pilots; they can be remotely controlled or flown autonomously using flight planning software, which requires sensors and a global positioning system (GPS) onboard the drone. With mission planning application software, the process of using a drone to map a field is quite easy. The mission planner lays out an automated flight path and can even make automatic takeoffs and landings. During drone missions, the aircraft collects images automatically using regular cameras and sensors with the aid of a GPS device to determine the location of each shot.
To fly a drone, a remote pilot license is required by Part 107 of the Federal Aviation Administration (FAA) rules. This FAA issued license demonstrates understanding of regulations, safety procedures, and ability to operate the drone.
Field mapping
Field maps cannot be created from a single image due to the limited angle and field of view for cameras and sensors and the legal flight altitude limitation of <400 ft above ground level. Therefore, drones are programmed to collect a few hundred to a few thousand images in a typical agricultural field. Such a mission cannot be achieved manually; thus, a mission planner software application is needed to assist with flight and data capture. Many mission planning applications are available for different phones and tablets. One of them is Pix4DCapture, which is easy to use and available for free. In Pix4DCapture, you can select the drone you are flying, the camera or sensor being used for mapping the field, and the units (meters or feet). Also, you can specify the flight altitude and customize image capture by adjusting the front and side image overlap percentages. The Pix4DCapture app displays a map of the present location and allows the user to specify the flight coverage area. After starting the drone and making sure that its software is up to date, the user can choose automatic taking off and landing before starting the flight mission. If more than one battery is needed, the drone automatically lands, and the mission can be resumed after it is replaced with a fresh one. All the images are saved on an SD memory card with storage size dependent on field size. After the mission is finished, the SD card can be removed from the drone and images transferred to a computer for processing.
Sensors and cameras
Drones can be equipped with digital RGB cameras for assessing crop health. Similar to visual inspection, an RGB image can be used to identify areas affected by plant growth limiting factors, such as weeds, insects, disease, and insufficient water & nutrients. Limiting growth factors can be identified in RGB images by using color differences to calculate the vegetation cover percentage over an area.
Multispectral sensors detect bands in the red, near infrared (NIR), and thermal areas of the electromagnetic spectrum. Reflectance of light in the red and NIR can be used to calculate the normalized difference vegetation index (NDVI), which is an index with values between 0-1 that indicates plant biomass or greenness. There are many vegetation indices; however, the NDVI is the most used index. Many growers are familiar with the value of NDVI imagery and use it to monitor crop growth, but this technology is not frequently used due to the high cost of drone services, limiting typical use to one-to-two flights per season, which is not frequent enough for crop management.
Satellite data has also been utilized for crop management. Recently, the OpenET satellite sensor network was made available to farmers with pixels of 30 x 30 m. The user can select NDVI, thermal, and evapotranspiration images (OpenET, 2022).
A crop management program can use both drones and satellites and select the best aspects of each system for different needs. One of the benefits of the drone data over satellite might be timeliness. Data can be collected any time instead of waiting for satellite flyover, making it a more flexible tool to assist with pest control, fertilizer use, and irrigation scheduling. One benefit of satellite data is that it requires no labor or image processing for the grower. A possible benefit of drones is that they can collect higher resolution data than satellites.
Image processing
There are many image-processing software packages that can be used to stitch the drone-based images together into a single image for vegetation index calculations. One of them is Pix4Dfields, which can finish the entire process for a 100- acre field in less than 30 minutes. It can be used to process both RGB (digital image) and multispectral data (stitch the images and calculate vegetation indices such as NDVI). The software is easy to use with some training; however, it is not free (about $3,500-$5,000 for a Pix4D perpetual license). There are other similar software packages available, such as ArcGIS Drone2Map, Drone-Deploy and Agisoft-Metashape.
Case studies
Field studies
The Sustainable Bioeconomy for Arid Lands project collected RGB and multispectral images from 2018 to 2022 in field experiments located at the University of Arizona Maricopa Agricultural Center (MAC), in Maricopa, Arizona, and the Agricultural Science Center (ASC), in Clovis, New Mexico.
The experiment at MAC (2022) was to study the effects of three irrigation rates (2.5, 2.0, and 1.5 acre-ft) and two irrigation methods (drip [D] and furrow [F]) on the growth and yield of direct-seeded guayule, a novel perennial desert shrub producing high-quality natural rubber after two years of growth. Remote sensing (RS) data was collected from two drone platforms. The first drone (Phantom 4 Pro V2.0, Da-Jiang Innovations [DJI], Nanshan District, China) collected RGB images at 30-60 m above ground level. The drone was equipped with a 25-mm, 20-megapixel CMOS detector with a mechanical shutter. The second drone (Inspire 2, DJI, Nanshan District, China) carried a MicaSense Altum sensor with five sensing bands (Blue [475 nm], Green [560 nm], Red [668 nm], Red Edge [717 nm], NIR [842 nm], and a thermal infrared (LWIR) band [8000-14000 nm].
The experiment at ASC (2020) was to study the effect of growth stage-based deficit irrigation on growth and yield of guar, a desert adapted legume cop. The study factors included pre-season irrigation (pre-irrigation [PI] and no pre-irrigation [No-PI] and growth stage based irrigation (full irrigation [FI], rainfed [R], vegetative stress [VeSt] and reproductive stress [ReSt]). Similar to the MAC study, RS data was collected from the two previously discussed drone platforms.
Crop canopy reflectance data was used to compute the NDVI using reflectance values in the red and NIR ([NIRred]/[ NIR+red]), which was developed to maximize sensitivity to the vegetation characteristics, while minimizing soil background reflectance, and atmospheric effects. The thermal infrared data was used to calculate canopy temperature (Ts = [LWIR value/100]- 273.15).
RGB and multispectral maps
The RGB images in Figure 1 were taken for a direct seeded guayule field in June-August 2022, 1-3 months after planting, at MAC. All images were taken at noon in the middle of an irrigation cycle, except for images 1A and 3B, which were captured on an irrigation day to showcase water ponding and leaks. The images were used to identify plant count (area 1), weed infestation (area 2), water leaks (area 3) and water ponding (area 4). RGB images are also able to be used to estimate canopy cover (fc) using the following steps: 1) conversion of RGB image data to hue, saturation, and intensity (HSI) color space; 2) classification of the hue channel into plant and soil classes, Figure 2A; and 3) dividing the number of pixels classified as plant by the total number of pixels to get fc (Figure 2B). This research demonstrated that drones carrying an RGB camera can be a great monitoring tool for crop development and detection of health or management issues in less time than required for in-field crop scouting.
The NDVI and surface temperature images (Ts) in Figure 3 were taken for the guayule field on June 14, 2022, 1.5 months after planting at MAC. The NDVI image, Figure 3A, is superior to an RGB image, Figure 1A, at detecting weeds. Also, the Ts maps can be used to identify irrigated and non-irrigated areas of the field; with green and blue colors in Figure 3B highlighting areas with lower temperatures, caused by plant transpiration evaporative cooling, in areas more recently irrigated. Similarly, Ts maps can be used to show leaks in the drip irrigation system identified by lower soil temperatures than the surrounding soil. For example, visual inspection of the green spots in area 3, Figure 3B, indicate water leaks. Ts can distinguish between plants receiving the higher irrigation rate (2.5 acre-ft having lower temperatures – blue/green color) and others receiving lower irrigation rate (1.5 acre-ft having higher temperatures – yellow color), Figure 3D. Mechanical weeding took place sometime between June 14 and Aug. 1, which can be recognized by comparing area 1 in figures 3A (higher NDVI values [greener area] due to the presence of weeds) and Figure 3C (lower NDVI values [less green and more yellow] due to the removal of weeds).
The NDVI was used to predict dry biomass, rubber yield, and resin yield of guayule. Such information would be needed in planning harvest and post-harvest operations, such as labor, transportation, and storage, as well as planning rubber and resin extraction, which are time sensitive. More information about yield prediction can be found in a recent publication by Elshikha et al, 2022.
The NDVI images, Figure 4A, were taken on Sep. 27, 2020, for the guar field at the ASC station. Data indicated the difference between the rainfed (area 1) and fully irrigated (area 2) treatments. However, skill is needed to interpret results as the difference among the other treatments was not easily definable. A thermal sensor would have been better in differentiating the cooling effect of the irrigation treatments. Zonal (per treatment) statistics indicated that NDVI had very good correlation (r=0.92) with gaur seed yield (Figure 4B). Prediction of yield can be used to plan for harvest and post-harvest operations, such as labor, transportation, and storage.

Figure 1A. RGB image taken June 14, 2022.
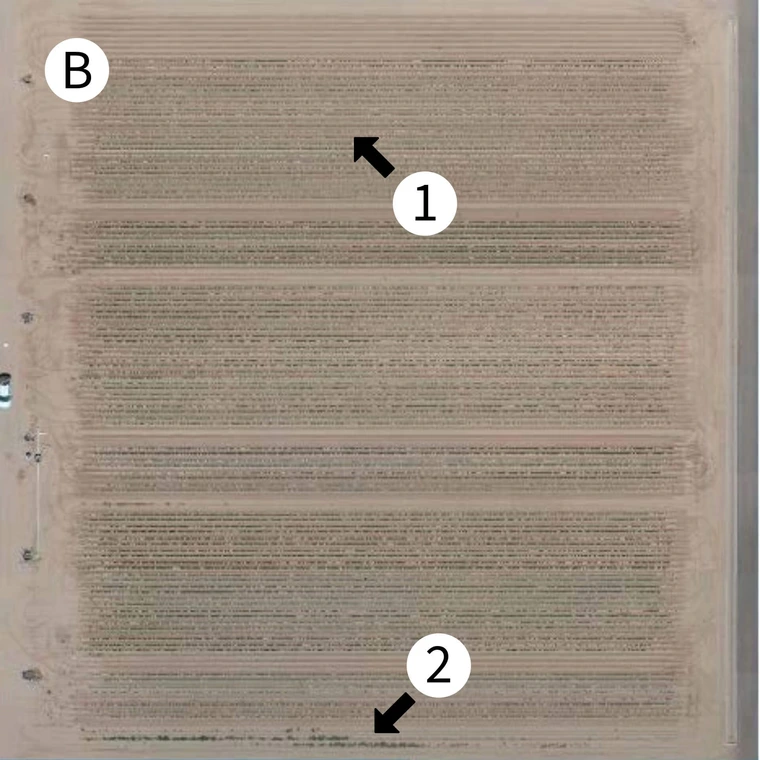
Figure 1B. RGB images taken in August 1, 2022.

Figure 2A. RGB image from August 1, 2022 converted to plant (white pixels) and soil (black pixels).

Figure 2B. Treatments F_2.5, D_2.5, D_2.0 and D_1.5 are furrow and drip treatments receiving 2.5, 2.0 and 1.5 acre-ft per year.
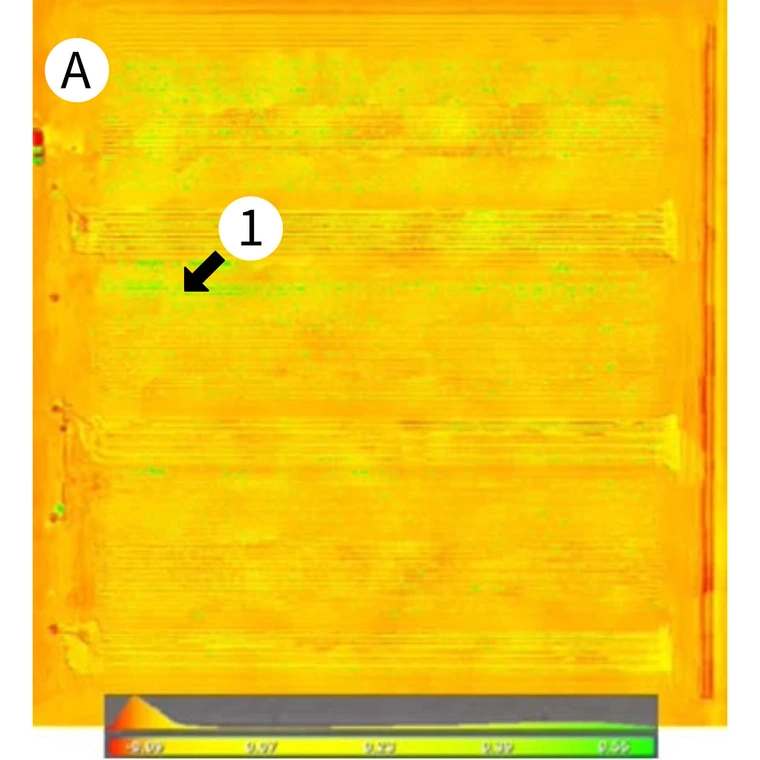
Figure 3A. NVDI image taken June 14, 2022 for a guayule irrigation experiment at the University of Arizona, Maricopa Agricultural Center in Maricopa, Arizona.
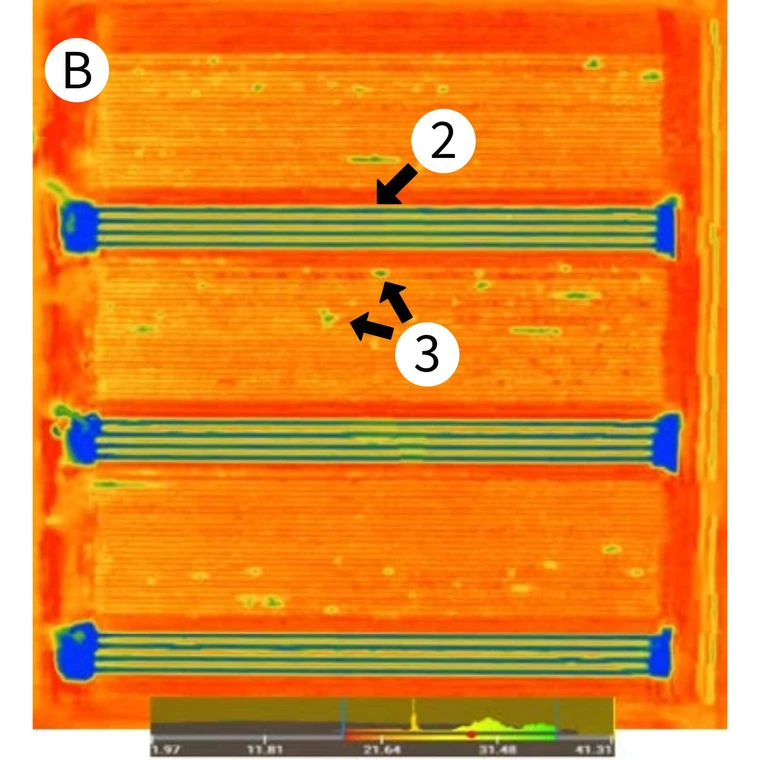
Figure 3A. Surface temperature (Ts) image taken June 14, 2022 for a guayule irrigation experiment at the University of Arizona, Maricopa Agricultural Center in Maricopa, Arizona.
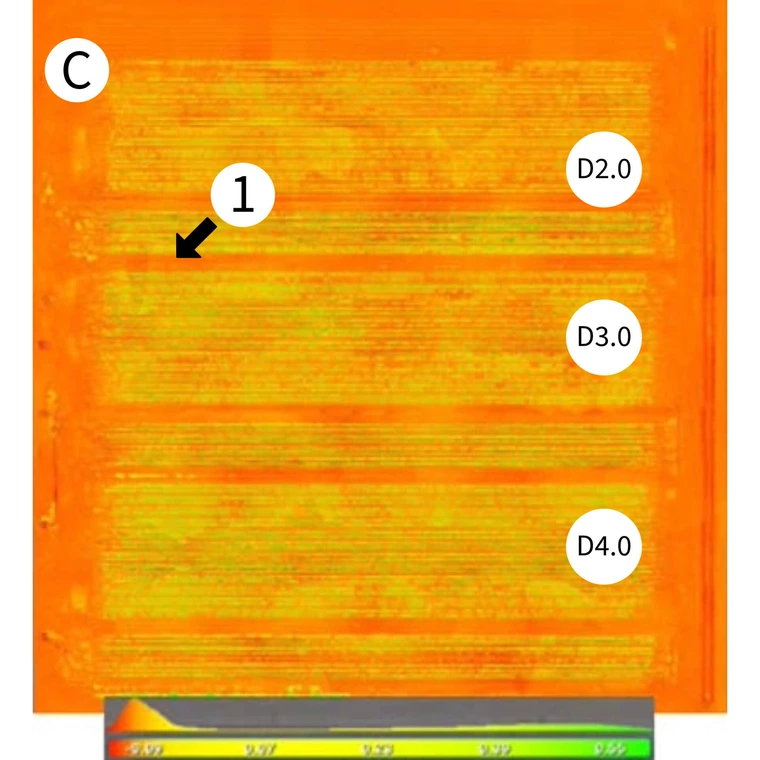
Figure 3C. NVDI image taken August 1, 2022 for a guayule irrigation experiment at the University of Arizona, Maricopa Agricultural Center in Maricopa, Arizona.
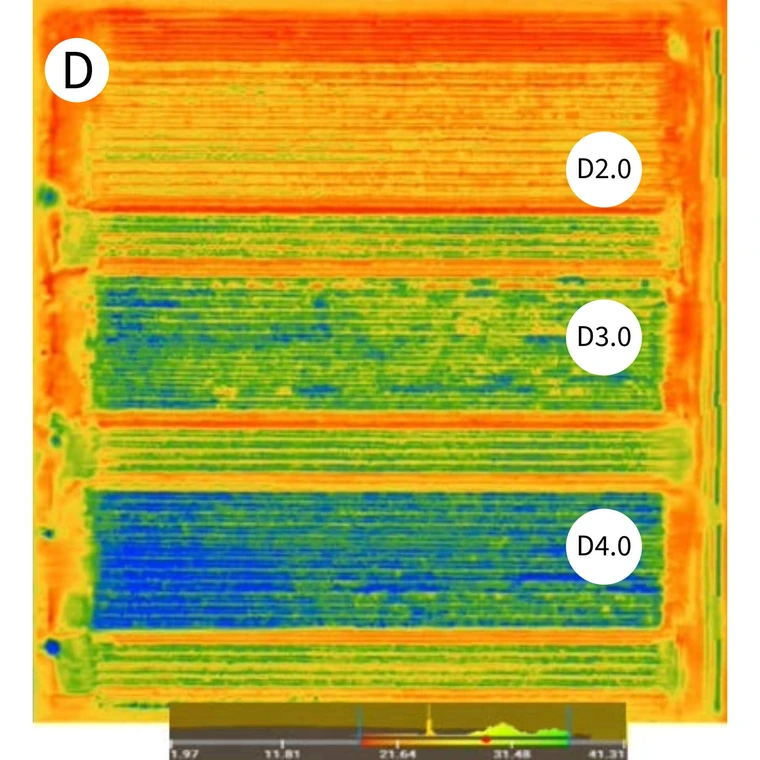
Figure 3D. Surface temperature (Ts) taken August 1, 2022 for a guayule irrigation experiment at the University of Arizona, Maricopa Agricultural Center in Maricopa, Arizona.

Figure 4A. NDVI image recorded Sep. 27, 2020.

Figure 4B. Average NDVI and seed yield for a guar irrigation experiment at the Agricultural Science Center in Clovis, New Mexico. PI, NPI, FI, VeSt, ReSt, and R are pre-irrigation, no pre-irrigation, fully irrigated, vegetative stress, reproductive stress, rainfed irrigation treatments.
Limitations
Despite the benefits of using drones in agriculture, there are some limitations.
Cost of service
Most drone companies charge $6.0-$9.0 per acre for their service (to provide NDVI images). For a 100- to 200-acre field, one flight would cost $600-$1,800. RGB mapping cost may be a little cheaper ($175-$250 per hour [Drone-U, 2022]), which is equivalent to $5/acre. For water management, a minimum of one flight would be needed every 1-2 weeks (6-10 flights for cotton, heading lettuce, cantaloupe, and 10-20 flights for silage corn, alfalfa, sudangrass). At this cost, growers may consider it as an unnecessary expenditure that would be easily replaced with visual inspection of the field, and not easily recuperated in the sale of the crop.
Cost of owning drones carrying sensors
Drones carrying multispectral and thermal sensors are relatively expensive ($10,000-15,000). Also, drones carrying built-in multispectral sensors are available, but they are made outside the USA, and they are expensive too [$10,000-$15,000] (Drone Fly, 2022). However, some drones carrying RGB cameras are relatively inexpensive ($1,700-$2,000).
Training and certification
Growers can fly the drones themselves; however, a trained pilot with a certificate from the Federal Aviation Administration is required for commercial applications of drones (FAA, 2022). Also, the drones must be registered with the FAA.
Image processing expertise
Image processing can be as simple as uploading an image to a processing website and then downloading the final image. A more advanced method would be using software installed on a desktop computer. This can be customized and should provide better results. However, the advanced method requires software training and expenses related to the maintenance of proprietary software licenses. Ongoing research on automation of image collection and processing will help the adoption of UAS technology in agriculture.
Battery life
Most drone batteries last for 20-25 minutes; therefore, multiple batteries would be needed for missions in commercial fields. Taking off and landing multiple times increases the risk of drone crashes even at low wind speeds. Some drones have batteries, which can last for 50-60 minutes; however, they are more advanced and expensive,50-300% higher in prices.
Not useful at every growth stage
NDVI can be a useful tool for determining crop health, but it may not be used during every growth stage. At full cover, NDVI can become saturated, reaching maximum values of 0.7-0.8, at which point it may no longer reflect actual condition of crops. Therefore, it is important to consider the limitations of NDVI when using it to evaluate crop health.
Summary
Drone mapping can be used to monitor crop development and detect health or management issues. It provides the grower with more precise early stress detection intelligence used to make data driven decisions. To be forewarned is to be forearmed, and that translates to more effective use of farm resources to bring home a crop. There are limitations associated with drone use for agriculture, but with the help of researchers who are experts in remote sensing and the development of good training programs and the daily advances in drone technology, costs can be lowered significantly. Currently, drones carrying multispectral and thermal sensors are expensive, but prices are declining. Therefore, a good alternative is the use of drones carrying RGB cameras. There are new RGB based vegetation indices that can be very useful in monitoring plant growth and detecting health issues. Also, they can be used for irrigation management. An RGB drone, $1,700-$2,000, can be a good start for growers as well as researchers; they are easy to fly, and image processing knowledge and time investment are much less than that associated with drones carrying multispectral or thermal sensors.
Future drone and satellite applications in agriculture are unlimited; therefore, this is the perfect time for researchers and growers to consider the integration of UAS technology into their agricultural operations. The rate of advances in UAS and sensor manufacturing technologies are expected to increase, while cost is expected to be reduced. Over time, new technology will become common and drone-sensor platforms may be adopted for management and yield prediction of crops.
References
Drone Fly. 2022. NDVI-Multispectral drone packages. Retrieved from https://www.dronefly.com/ndvi.html.
Drone U. 2022. How to price your drone mapping services. Retrieved from https://www.thedroneu.com/blog/howto-price-your-drone-mapping-services.
Elshikha, D.M., Hunsaker, D.J., Waller, P.M., Thorp, K.R., Dierig, D., Wang, G., Cruz, V.V., Katterman, M.E., Bronson, K.F., Wall, G.W., Thompson, A.L., 2022. Estimation of direct-seeded guayule cover, crop coefficient, and yield using UAS-based multispectral and RGB data. Agricultural Water Management 265, 107540.
FAA. 2022. Commercial operators. Federal Aviation Administration. Retrieved from https://www.faa.gov/uas/commercial_operators.
OpenET. 2022. OpenET for Growers and Rural Communities. Retrieved from https://openetdata.org/how-to-use-datafrom-openet/openet-for-growers.