How much of Arizona’s agricultural production remains in-state to be consumed by Arizonans? This question is increasingly of interest considering the structure of our food system and the connection between agriculture and the use of water and other natural resources. Proponents of local food efforts cite a number of benefits of consuming local foods, including strengthening the local economy, improved taste and nutrition compared to non-local foods, and environmental benefits (Deller et al., 2020; Michigan State University Extension, 2013). However, the question of how much of the state’s agricultural production remains in-state is quite difficult to answer as there is no established method for accurately estimating local consumption of locally produced food (Conner et al., 2013).
Local consumption of agricultural products involves direct consumption by households. In many cases, however, agricultural production is also used as an input for other production processes. For example, dairy cattle consume alfalfa as feed, and then those cows produce fluid milk, some of which is transformed into cheese and butter for final consumers. Although alfalfa is not consumed directly by Arizonan residents, it supports the production of food commodities consumed in-state. Considering that Arizona- produced goods can be transformed into final products in- state or out-of-state, estimating local consumption becomes very complex.
The popularity of local and regional foods has grown in recent years. Perhaps more significant in magnitude, however, is the supply of foods and agricultural products sourced locally or regionally by design or necessity but not necessarily marketed as local. Essentially, Arizonans may be consuming local food without knowing it. Here, we estimate the value of Arizona-grown agricultural products that are consumed in-state. We examine three groups of commodities that contribute to the share of Arizona’s agricultural production that stays in-state: vegetables and melons, fluid milk, and feed crops.
Summary of findings
In 2021, the total value of Arizona's agricultural production was nearly $4 billion, of which 37% was exported to foreign markets (Table 1). Cotton is an example of a heavily exported Arizona-grown crop, with 82% of production exported in 2021. The remaining 63% of the state’s total agricultural production, by value, was either consumed in-state or shipped domestically to other states. Our estimates show that livestock feed crops have the highest percentage in-state consumption, at 78% of theproduction value. An estimated 22% of Arizona fluid milk production was consumed in-state in 2021. For vegetables and melon, in-state consumption represented only 7% of the state’s production.
Table 1. Summary of Results 2021 (Million U.S.$)
Vegetables & Melon | Fluid Milk | Feed Crops | All Other Arizona Ag | Total | |
Value of Arizona Production | $734 | $848 | $523 | $1,886 | $3,991 |
Value of Foreign Exports | $137 | $47 | $88 | $1,198 | $1,470 |
Value of In-State Consumption | $48 | $186 | $435 | -- | -- |
Value of Out-of-State Sales | $549 | $615 | $0 | -- | -- |
Foreign Exports as % of Value of Production | 19% | 6% | 17% | 64% | 37% |
Value of In-State Consumption as % of Value of Production | 7% | 22% | 83% | -- | -- |
Value of Out-of-State Sales as % of Value of Production | 75% | 73% | 0% | -- | -- |
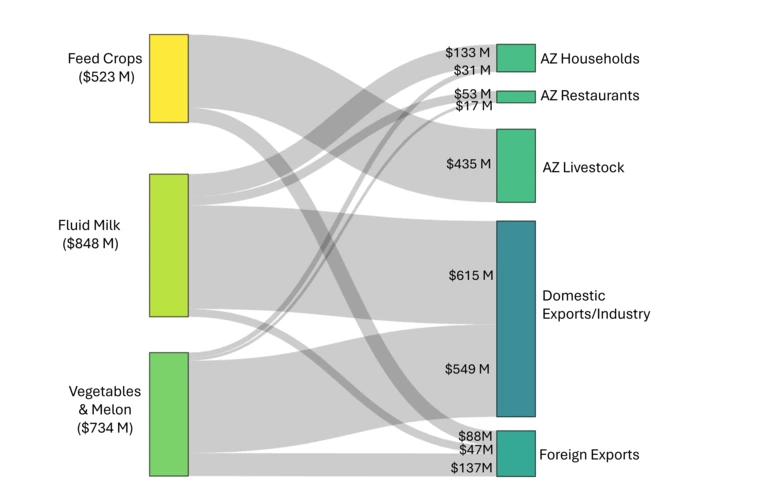
In Figure 1, we can see how Arizona’s production of these three commodity groups (feed crops, fluid milk, and vegetables and melon) is destined for different uses and market channels. Estimates show that these agricultural products are either shipped to other states as final products or are used as inputs within more sophisticated value chains, both in other states and in Arizona. This suggests that most of Arizona’s production of these commodities serves to meet national demand, both within households and industries. In the case of feed crops, most of what is produced remains in Arizona to support the livestock sector.

Figure 1: Uses of Arizona Feed Crop, Fluid Milk, & Vegetables & Melon Production
Vegetables and mellons
Western and Central Arizona, particularly the Yuma area, play niche roles in the production of specialty vegetable and melon crops (Duval, 2023). Because of their geography and climate, during times of the year when domestic production of leafy greens, other vegetable, and melon crops is not feasible, Western Arizona, and at times Central Arizona, may serve as a leading or even exclusive sources of certain commodities at the national level. Western Arizona is recognized as an important location for the production of winter vegetables, particularly leafy greens such as iceberg lettuce, Romaine lettuce, other lettuce, and spinach. Other top commodities produced in Western Arizona by weight include celery, cantaloups, cauliflower, broccoli, watermelon, and cabbage. Top specialty crop commodities produced in Central Arizona by weight include cantaloups, watermelons, honeydews, and other mixed and miscellaneous melons, as well as cabbage, broccoli, iceberg lettuce, herbs, and kale.
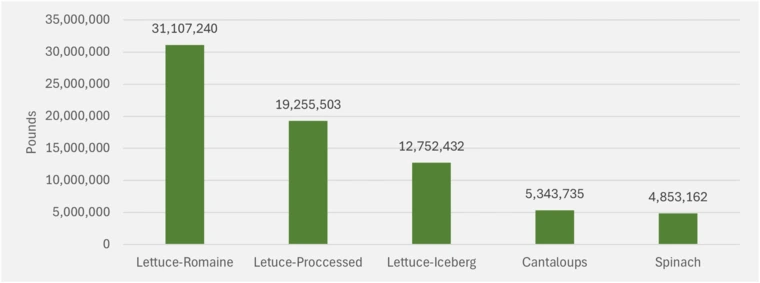
In 2021, Arizona produced more than 2 billion pounds of lettuce, spinach, and cantaloupes, equivalent to approximately $733 million in value, and exported 18% of it to foreign markets (U.S. Census Bureau, 2023). To better understand how much of this produce stays in-state, we estimate household consumption of the main vegetables and melon production. We assume that in any month when Arizona grows at least half of the national supply of crops (including imports), local stores would mostly buy from Arizona farms. We use per-capita loss-adjusted consumer availability1 data of vegetable and melon commodities in the U.S. to estimate Arizonans’ actual consumption. In- state consumption is estimated by subtracting Arizona’s monthly produce demand from its monthly production— but only during months when Arizona provides at least 50% of the total U.S. supply (Figure 2). In those months, we assume that Arizona-grown produce can fully meet local demand, as long as the amount produced is equal to or greater than what Arizonans consume.

Figure 2: Estimated Arizona-Grown Fresh Produce Consumed In-State by Commodity
The estimated value of household consumption is $11.5 million for romaine lettuce, $9.3 million for iceberg lettuce, $1.7 million for cantaloupes, and $8.1 million for spinach, which in total represents 4% of the total value of vegetable and melon production in Arizona.
Due to the complexity of the food supply chain, in- state retailers and wholesalers may not necessarily source Arizona-grown produce first before out-of-state produce, especially considering the state’s proximity to California. Nonetheless, this is a conservative estimate due to the assumption that supply is sourced from in-state only when Arizona represents 50% or more of the national supply, in a given month. Local production also supplies restaurants and schools in Arizona, totaling an equivalent of $17 million of vegetable and melon in 2021 (IMPLAN Group LLC, 2021).
Household, restaurants, and schools’ consumption and foreign exports account for 28% of production. The remainder is shipped domestically to other states or used for other productive processes either in Arizona or elsewhere in the United States (U.S. Department of Transportation, 2017).
1 Per-capita loss-adjusted consumer availability was taken from the Loss-Adjusted Food Availability (LAFA) database provided by USDA ERS. This data serves as a proxy for actual consumption at the national level. It is derived from food availability data by adjusting for food spoilage, plate waste, and other losses to more closely approximate actual consumption.
Feed crops
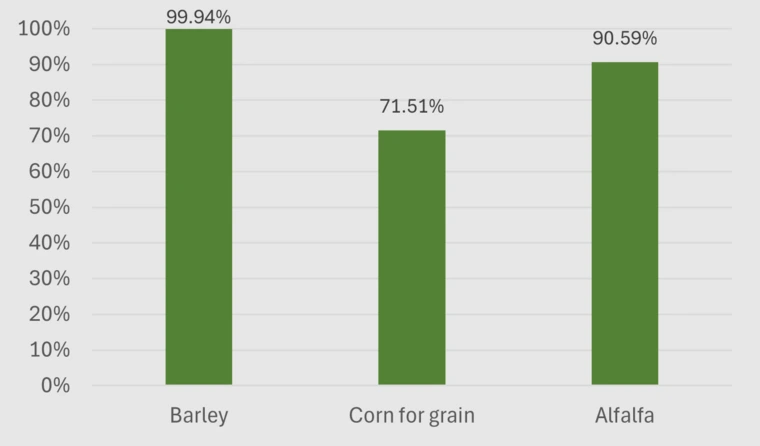
Feed grain production primarily supports the dairy industry in Arizona. In 2021, Arizona produced 2 million bushels of barley, 3.3 million bushels of corn for grain, 2.1 million tons of corn silage, and 2.3 million tons of alfalfa (USDA, 2021). To calculate crop production that stays in Arizona, we assume that all production not exported to foreign countries is consumed in-state by livestock. Under these assumptions, we estimate that in 2021 over 90% of the barley and alfalfa produced in Arizona were consumed in-state by livestock. The estimated consumption is $9.8 million for barley and $408 million for alfalfa. Similarly, over 70% of locally grown corn for feed remains in Arizona for the same purpose, with an estimated value of $18 million.

Figure 3: Estimated Feed Crop Production Consumed by Livestock In-State by Commodity 2021
Fluid milk
Though not often marketed as local, fluid milk is typically produced within close proximity to where it is consumed due to its highly perishable nature. In Arizona, dairies are concentrated in Central Arizona in Pinal and Maricopa counties (Bickel et al., 2018), well-situated to supply the Phoenix and Tucson metro areas which represent a large majority of the state’s population. In 2021, Arizona dairies produced 4.8 billion pounds of fluid milk, an estimated $848 million (USDA NASS, 2023). Of total production, $47 million was exported to foreign markets (U.S. Census Bureau, 2023), 6% of total production by value.
To calculate local consumption, we first estimate statewide household demand for fluid milk. We assume that Arizonans consume the national average per- capita amount of fluid milk annually. Hence, household consumption is estimated at 754 million pounds (equivalent to $133 million and 16% of total production in Arizona by value). Part of Arizona’s fluid milk production is used by other local sectors, such as restaurants and schools, with purchases totaling an estimated $53 million in 2021 (6% of total production by value). We assume milk purchased by restaurants and schools is consumed locally. Therefore, counting consumption by households, restaurants, and schools, 22% of the production by value of fluid milk is directly consumed, while 6% goes to international markets.
The remaining 72% (an estimated value of $615 million) stays in the United States. Some of it is transformed into other dairy products, such as concentrated, condensed, powdered, or sweetened milk or cream, butter, and whey, among other products. A previous study focused on analyzing the Federal Milk Marketing Orders (FMMO), found that in 2017 the FMMO 131 (the only FMMO in Arizona) sent 3% of its fluid milk production to the Southwest FMMO region, made up of New Mexico and Texas (Hanon, 2023). With this information, and assuming that the productive structure did not change significantly between 2017 and 2021, we can say that 69% of fluid milk production (an estimated value of $585 million) stays in Arizona for processing. Further research is needed to understand post-processing value chains for Arizona’s processed dairy products.
Discussion
Our estimates show that much of Arizona’s production of feed crops, vegetables and melon, and milk is consumed in-state, either directly by people or indirectly by livestock. Fresh vegetables and melon, and fluid milk are directly consumed by households, restaurants, and other food service establishments. In the case of vegetables and melon, only 7% of the local production is consumed by Arizonans. Most of it is shipped to other states (75%). Local milk production is also mostly sent to other states (73%) and an estimated 22% is consumed locally in Arizona. Feed crops, on the other hand, are used as intermediate inputs for livestock production, 83% of which are consumed in- state, and 17% are exported to foreign markets.
These commodities and the resources used to produce them, including water, are used in part to satisfy local demand. Beyond local demand, the remaining production is exported or used to fulfill domestic demand in other parts of the country. Recently, controversy has arisen around the issue of “virtual” water exports from Arizona to foreign countries through the export of water-intensive crops. Such issues concerning the use of the state’s limited water resources are important considerations in grappling with the ongoing water crisis in the West, however, there are important nuances to consider.
Our findings highlight the need to make a distinction between a foreign “virtual” water export and a domestic “virtual” water export. Crops are grown as intermediate inputs to other industries, so assessing the water footprint generated by domestic processing could give insights into water use pressure in Arizona.
To understand the issue of water use in agriculture more comprehensively, it is helpful to look at how much water is used to grow crops for direct consumption and how much goes into crops that are later turned into value-added products. In other words, we need to identify the water footprint by type of use – household, food service and school, livestock, and foreign and domestic exports. To accurately quantify these footprints, we need up-to-date consumptive use data. However, accessing a good estimate on water use/consumptive use/water withdrawals, evapotranspiration, and related variables by crop remains a challenge.
In summary, the question of how much Arizona’s agricultural production is consumed in-state is a kick- start to continue exploring the intersection between water policy and our food system. Improved methodologies and data on domestic trade in agricultural products could inform a much deeper understanding of how water moves “virtually” around the country and around the world. This may lead to new insights into where efficiencies and more responsible stewardship of limited natural resources could be achieved.
References
- Bickel, A. K., Duval, D., & Frisvold, G. (2018). Contribution of on-farm agriculture and agribusiness to the Pinal County economy. University of Arizona, Cooperative Extension: Tucson, AZ, USA.
- Conner, D., Becot, F., Hoffer, D., Kahler, E., Sawyer, S., & Berlin, L. (2013). Measuring current consumption of locally grown foods in Vermont: Methods for baselines and targets. Journal of Agriculture, Food Systems.
- Deller, S. C., Lamie, D., & Stickel, M. (2020). Local foods systems and community economic development. Local Food Systems and Community Economic Development, 4-30.
- Duval, D. (2023). Arizona’s Seasonal Role in National Supply of Vegetable & Melon Specialty Crops.
- Hanon, T. M. (2023). Mapping Milk: Investigating the Effects of Federal Milk Marketing Orders on the Geography of Milk Production and Inter-Regional Trade in Milk and Dairy Products. University of California, Davis.
- IMPLAN® model, (2021) Data, using inputs provided by the user and IMPLAN Group LLC, IMPLAN System (data and software). www.IMPLAN.com
- Michigan State University Cooperative Extension (2013). 7 Benefits of Eating Local Foods. Retrieved from https:// www.canr.msu.edu/news/7_benefits_of_eating_local_ foods
- United Dairymen of Arizona. (n.d.). Who we serve: Customers. United Dairymen of Arizona. https:// www.uda.coop/who-we-serve/customers
- U.S. Department of Transportation, Bureau of Transportation Statistics; and, U.S. Department of Commerce, U.S. Census Bureau. (2022-07-27). SPC01 - CF1700A21, Geographic Area Series: Shipment Characteristics by Origin Geography by Destination Geography by Selected 5-digit Commodity by Mode. [custom tabulation]. 2017 Commodity Flow Survey.
- USDA NASS (2021). Arizona Agricultural Statistics. Retrieved from https://www.nass.usda.gov/Statistics_by_State/Arizona/Publications/Annu… Statistical_Bulletin/2021/AZA nnualBulletin2021.pdf
- USDA ERS (2023). Loss-Adjusted Food Availability (LAFA). Retrieved from https://www.ers.usda.gov/data-products/food-availability-per-capita-dat…
- USDA AMS (2023). Fresh Fruit and Vegetable Shipments. FVAS-4 Calendar Year 2022. Retrieved from https://www.ams.usda.gov/market-news/fruit-and-vegetable-movement-reports
- Vermeulen, S. J., Campbell, B. M., & Ingram, J. S. (2012). Climate change and food systems. Annual review of environment and resources, 37(1), 195-222.

