
Computer Models and Decision-Support Platforms for Precision Irrigation Management
Effective irrigation management not only sustains healthy crop growth but also helps ensure reliable yields while making the best use of limited water supplies. Irrigation models and decision-support platforms make it easier to plan and manage for irrigation efficiency. Adoption of such technologies is crucial in the face of the inevitable water scarcity risk (Elsadek et al., 2023), particularly in arid and semi-arid regions like Arizona (e.g., Attalah et al., 2025; Elsadek et al., 2026, 2025; Elshikha et al., 2025a, 2025b). This publication introduces and compares two simulation models: the WINDS (Water-Use, Irrigation, Nitrogen, Drainage, and Salinity) model (Waller and Yitayew, 2016), the pyfao56 FAO‑56 modeling engine (Thorp, 2022), and three different platforms: the CropManage, the OpenET satellite‑based evapotranspiration, and the SWAN Systems, aiming to provide growers, farm managers, consultants, and extension professionals with the information needed to enhance irrigation decisions and strengthen water management planning.
Simulation models
The WINDS model
WINDS (Water-Use, Irrigation, Nitrogen, Drainage, and Salinity) is an irrigation model, developed by Waller & Yitayew (2016), that provides decision support for managing irrigated crops in the U.S. Southwest. The WINDS model uses a daily time-step soil water balance (SWB) to simulate the dynamics of water content in the soil profile and crop evapotranspiration. It calculates crop evapotranspiration (ETc) with the FAO56 dual crop coefficient procedure and simulates soil water content changes in discrete layers of the soil profile. Besides water content simulation and irrigation prediction, the WINDS model also handles salinity management, nitrogen application, and drainage performance. The WINDS model evaluates several key factors to support irrigation decision‑making. These include irrigation information (timing and amounts), weather data (daily minimum and maximum temperatures, relative humidity, rainfall, and evapotranspiration), crop characteristics (growth‑stage duration, crop‑coefficient values, planting and harvest dates, canopy cover, plant height, and root depth), and soil‑moisture conditions. Using these inputs, the model simulates daily soil‑water depletion along the soil profile and generates irrigation recommendations based on the current depletion level relative to a specified maximum allowable depletion. The main features, data inputs, outputs, strengths, and limitations are summarized in Table 1.
Table 1. Main Features of the WINDS (Water-Use, Irrigation, Nitrogen, Drainage, and Salinity) Model
| Features | Details |
|---|---|
| Primary purpose | Modeling of evapotranspiration, soil water, salinity, and nitrogen, in soil layers, and drainage. |
| Data inputs | Weather data (ET, climate), soil moisture and soil properties, irrigation events (furrow, surface, or pressurized systems), crop parameters (growth stages, rooting depth), and reference ET. |
| Platform/environment | Research software developed by the University of Arizona and shared as Google Colab. |
| Core processes/algorithms | Dual component evapotranspiration modeling (Kcb + Ke), Infiltration modeling (fixed depth or Green Ampt infiltration), soil water balance, water stress, and yield reduction modeling based on stress sensitivity, nitrogen, drainage, and salinity components |
| Outputs | Crop evapotranspiration (ETc), soil water content and depletion, water stress indicators, irrigation performance evaluation, drainage, nitrogen, and salinity estimates. |
| Strengths | Besides water content, it simulates soil salinity and nitrogen. Works for any crop and any irrigation system using FAO 56 parameters, free access. |
| Limitations | Requires Python skills to modify. No automation capability, requires technical skill to set up, not a daily scheduling tool, requires detailed field measurements and calibration. |
| Typical end users | Researchers, consultants, and advanced on-farm irrigation management. |
pyfao56
The pyfao56 is a Python-based software package developed by Thorp (2022) to support crop water use and irrigation scheduling, utilizing the FAO-56 method, as described in Allen et al. (1998). It computes reference ET (ETo) using the American Society of Civil Engineers (ASCE) standardized equation (Walter et al., 2005) and generates irrigation scheduling recommendations.. The software includes subpackages for script customization related to weather data, soil information, and sensor-based measurements of soil water content. The main strength of the pyfao56 package is the modular coding design, which permits researchers, university extension professionals, and commercial organizations to incorporate pyfao56 code into their own customized irrigation management interfaces and workflows (e.g., the Oklahoma Agricultural Scientific Irrigation Scheduler, HydroAgriNexus FAO-56 Soil Water Simulator, and the Agroptics satellite irrigation technology platform). The main features, data inputs, outputs, strengths, and limitations of pyfao56 are summed up in Table 2.
Table 2. Main Features, Data Inputs, Outputs, Strengths, and Limitations of pyfao56.
| Features | Details |
|---|---|
| Primary purpose | Calculate crop evapotranspiration (ET) and run a daily soil water balance model using FAO 56 single and dual crop coefficient methods. |
| Data inputs | Weather data (temperature, humidity, wind speed, solar radiation, pressure), crop parameters (Kc, Kcb, Ke, growth stages, root depth), soil parameters (field capacity, wilting point, depletion fractions), and irrigation and rainfall data. |
| Platform/environment | Free Python package (open source), runs on any system with Python (Windows, macOS, Linux), command line or script-based use. |
| Outputs | Daily crop evapotranspiration, soil moisture/root zone depletion, water stress, coefficient (Ks), irrigation timing and depth recommendations, and full daily water balance dataset. |
| Strengths | Implements official FAO 56 methods accurately, supports both single and dual crop coefficient approaches, customizable, ideal for research, modeling, and algorithm development, validated in arid region field studies (e.g., Arizona cotton). |
| Limitations | Requires Python skills, no built-in graphical user interface or dashboards, no nutrient or nitrogen modeling, requires users to supply data (weather, soil, and crop data). |
| Typical end users | Irrigation researchers with advanced Python knowledge, developers building irrigation decision tools, and water resource modelers. |
Platforms
CropManage
CropManage is a free, online decision‑support platform developed and validated by the University of California Cooperative Extension to guide irrigation and nitrogen management for specific crops. Users create an account through the CropManage website and, once logged in, can enter key operational details such as planting areas, fertilizers, weather stations, water sources, commodities, and team members. A detailed technical guide is available online for additional support. The platform can be accessed through any web‑enabled device, including desktops, laptops, tablets, and smartphones. Users can record information about irrigation, fertilizer applications, soil and plant sampling, etc., which serve as inputs for generating recommendations on irrigation timing and duration, as well as nitrogen application rates. For irrigation scheduling, CropManage incorporates ET data from nearby California Irrigation Management Information System (CIMIS), crop growth stage, soil type, and field conditions. For nitrogen recommendations, the model accounts for residual soil nitrate, nitrogen in irrigation water, mineralization from soil and amendments, crop growth rate, and projected yields. The main features of the CropManage platform are presented in Table 3.
Table 3. Main Features of the CropManage Platform
| Features | Details |
|---|---|
| Primary purpose | Real-time irrigation and nitrogen fertilizer recommendations. |
| Data inputs | Crop type and planting date, soil type and field characteristics, irrigation system details, weather/ET data (CIMIS), soil nitrate tests (optional), and irrigation and fertilizer events. |
| Platform/environment | Web-based application (no installation), and a free mobile-friendly interface for field use. Visit the CropManage website to download and learn more. |
| Core processes | Computes crop ETc using CIMIS ETo + UC crop coefficients, estimates nitrogen uptake using UC nutrient uptake curves, generates irrigation runtimes and N application rates, and updates recommendations dynamically as events are logged. |
| Outputs | Daily irrigation recommendations (timing, runtime, volume), nitrogen fertilizer recommendations, field-level logs for irrigation and fertilizer events, compliance-ready reports, crop growth and water use summaries. |
| Strengths | Free, research-validated, and easy to use, strong nitrogen management tools, reliable for compliance and recordkeeping, and mobile-friendly for field usage. |
| Limitations | Designed mainly for California (uses CIMIS weather data), limited crop list compared to commercial platforms, not optimized for Arizona unless ET is manually adjusted, and no sensor integration (soil moisture, flow meters, etc.). |
| Typical end users | Vegetable and berry growers, California specialty crop producers, irrigation managers and pest control advisers (PCAs), water quality compliance programs, and researchers/extension specialists |
OpenET
OpenET, a satellite‑based platform that provides water‑use information for fields, farms, and entire watersheds across the western United States, through a web‑based interface, API, Data Explorer, and FARMS tools, was developed by the OpenET Consortium, integrating expertise from U.S. research institutions, NASA centers, nonprofit data‑science partners, and the Universidade Federal do Rio Grande do Sul in Brazil to deliver operational, satellite‑derived evapotranspiration datasets. OpenET uses publicly available satellite data, primarily from the Landsat program (NASA + USGS), combined with weather data and six ET models (SSEBop, PT‑JPL, SIMS, DisALEXI, eeMETRIC, and geeSEBAL), to estimate daily, monthly, and annual ETc, and ETo, within a spatial resolution of 0.22 acre/pixel. The results from the six models are then averaged into an Ensemble to improve accuracy. Additionally, the normalized difference vegetation index (NDVI) and precipitation (P) can be generated. The satellite-based OpenET database can be accessed online. The main ways to retrieve the data are: (1) Navigating to “Data Explorer” interface or “FARMS tool” to draw areas of interest using a polygon drawing tool, and further launching the “run time series” application or, (2) Navigating to “OpenET API” to use the OpenET application programming interface.
As shown in Figure 1, the “Data Explorer” method will require the following steps: 1) create user account at https://etdata.org/, (2) sign in and go to “Data Explorer” to select the inputs (period, and units), (3) use the “Draw custom area” icon to delimit the area of interest, 4) select models and the desired parameters, and (5) download data as image, csv, or pdf for further analysis and implementation. While both “Data Explorer/FARMS tool” and “API” provide the same outcomes, only a limited 5 to 6-year archived data can be downloaded manually through “Data Explorer/FARMS tool”, whereas the API can retrieve data over 30 years or longer. For users who are not familiar with programming, the “Explore Data/ FARMS tool” method is recommended. More information about the OpenET dataset description and data acquisition can be found in Attalah et al. (2025, 2024), Elsadek et al. (2026), and Elshikha et al. (2025). The main features, data inputs, outputs, strengths, and limitations of OpenET are summarized in Table 4.
Table 4. Main Features of the OpenET Platform
| Features | Details |
|---|---|
| Primary purpose | Satellite-based evapotranspiration (ET) data, designed for field-scale (0.22 acre/pixel resolution) ET mapping across 23 western U.S. states. |
| Data inputs | Satellite imagery, multiple ET models with an Ensemble approach, and publicly available weather and climate data. |
| Platform/environment | Web based platform with tools such as Data Explorer, API, and FARMS tool, cloud-hosted, and accessible via browser. |
| Outputs | Daily, monthly, and annual ET estimates, field level ET time series and maps, downloadable ET datasets, tools for water use tracking and compliance reporting. |
| Strengths | Science-based, multi model ET estimates, field scale resolution suitable for agriculture and groundwater management, free or low-cost access to ET data, supports water district, farm, and basin scale planning |
| Limitations | Mainly focuses on evapotranspiration estimates (no irrigation scheduling, no nutrient modeling, no salinity management), current coverage limited to the western U.S., dependent on satellite overpass frequency and cloud-free imagery, requires users to interpret ET data or integrate it into other tools for further implementation. |
| Typical end users | Farmers and ranchers, water districts and groundwater sustainability agencies, State and regional water managers, researchers and conservation organizations, policy makers and basin scale planners. |
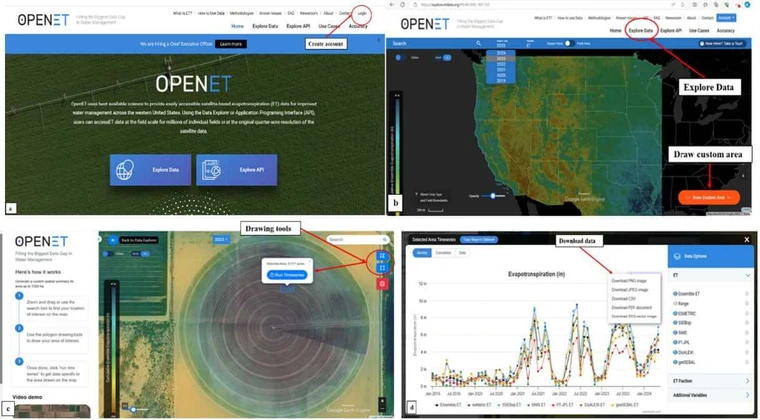
Figure 1. OpenET data retrieval using “Data Explorer” method showing a) where to create an account, b) How to select the period of interest and units of measurement, c) How to delineate the area of interest using the drawing tools, d) How to select the models and parameters of interest
Adapted from https://etdata.org/openet-data-explorer/
SWAN Systems
SWAN (Systems for Water, Nutrients, and Precision Irrigation) Systems was developed by Swan Systems Pty Ltd, an Australian agricultural technology firm specializing in cloud‑based irrigation and nutrient‑management solutions. SWAN Systems uses an integrated approach that combines weather, soil, and crop data to optimize water management. Current and historical information is collected and processed within SWAN software, which analyzes the inputs and generates recommendations for implementing an appropriate irrigation schedule, including daily plans up to seven days in advance. The system also capable of evaluating the water budget, calculating water application and water‑use efficiency, deriving crop coefficients from satellite imagery, and managing nutrient applications (Figure 2).
The SWAN Systems tool evaluates several key factors to support irrigation and nutrient management. These include historical climate records (up to seven years of rainfall and evapotranspiration data), forecasting tools (rainfall, reference evapotranspiration, and seven‑day soil‑moisture projections), crop water requirements (crop coefficients and growth stages), available water resources, and periodic data comparisons for planning refinement. Access to SWAN Systems requires a subscription through the company’s website, which provides account setup, mobile application access, and post‑handover support. The platform interface includes an interactive Google‑based map, water‑use summaries, forecasting tools, a nutrient‑management panel, system alerts and settings, and visual displays such as soil‑moisture trend graphs (Figure 3). The main features of the SWAN Systems platform are presented in Table 5.
Table 5. Main Features of the SWAN Systems Platform
| Features | Details |
|---|---|
| Primary purpose | Irrigation and nutrients scheduling |
| Data inputs | Weather data (local stations, forecasts), soil moisture, flow meters/irrigation system data, crop type and growth stage, field boundaries and irrigation zones, fertilizer plans, and nutrient data. |
| Platform/environment | Cloud-based web platform, mobile-friendly interface, integrates with sensors, telemetry, and irrigation controllers, subscription-based commercial software. Visit the SWAN Systems website to download and learn more. |
| Outputs | Irrigation schedules (timing, duration, volume), water use dashboards and KPIs, nutrient management recommendations, field-level performance reports, alerts for over or under watering, compliance, and audit ready logs. |
| Strengths | Works across many crops and climates, integrates with multiple sensor types, strong dashboards for managers and field staff, supports multi site and multi field operations, including nutrient and fertigation planning, commercial support and onboarding |
| Limitations | *Requires subscription fees, requires reliable sensor data for best performance, and lacks salinity modeling. |
| Typical end users | Farms (row crops, orchards, vegetables), turf and landscape managers (golf, parks, councils), irrigation managers and consultants, municipalities and water authorities, large operations needing dashboards, reporting, and multi site control. |

Figure 2. SWAN Systems diagram.

Figure 3a. SWAN Systems dashboard illustration of the location of selected sites.

Figure 3b. SWAN Systems dashboard illustrations of soil moisture status, crop health summary, water usage vs. water budget, actual water usage summary, and forecast soil moisture summary.

Figure 3c. SWAN Systems dashboard illustration for available water with allocation performance and usage.

Figure 3d. SWAN Systems dashboard illustrations for planned and actual applied nutrients of the four major nutrients: nitrogen, phosphorus, potassium and sulfur.
Summary and recommendations
The irrigation management tools reviewed in this publication serve different but interrelated purposes. The WINDS model functions as a field-scale model for evaluating soil water, salinity, and related processes, while the pyfao56 model is a FAO-56 evapotranspiration and soil-water-balance analysis model designed for customized integration within other software platforms and user interfaces. The OpenET platform provides satellite-derived evapotranspiration data rather than direct management recommendations, and CropManage focuses on crop-specific irrigation and nitrogen management. SWAN Systems is designed as a farm-scale platform that integrates irrigation and nutrient management
Because these tools are intended for different applications, selection should be guided by the required management level and objectives. Platforms such as SWAN Systems and CropManage are better suited for operational irrigation scheduling, particularly when sensor data or crop-specific recommendations are desired. The current version of WINDS is more appropriate for scenario analysis and salinity management, while OpenET is useful for accessing regional or field-scale ET information. In practice, using more than one tool may provide the most effective support, especially when irrigation scheduling, evapotranspiration estimation, salinity management, and automation are all part of the management strategy.
Disclaimer
This publication provides an objective summary of the reviewed irrigation models and platforms and does not endorse or promote any brand, product, or trademark. Any references to product names, trademarks, or companies are included for informational purposes only.
References
Allen, R.G., Pereira, L.S., Raes, D., Smith, M., 1998. Crop evapotranspiration-Guidelines for computing crop water requirements-FAO Irrigation and drainage paper 56. FAO, Rome, Italy.
Attalah, S., Elsadek, E.A., Waller, P., Hunsaker, D., Thorp, K., Bautista, E., Williams, C., Wall, G., Orr, E., Elshikha, D.E., 2024. Evaluating the Performance of OpenET Models for Alfalfa in Arizona, in: 2024 Anaheim, California July 28- 31, 2024, ASABE Paper No. 2400041. American Society of Agricultural and Biological Engineers, St. Joseph, MI, p. 1. https://doi.org/10.13031/aim.202400041
Attalah, S., Elsadek, E.A., Waller, P., Hunsaker, D.J., Thorp, K.R., Bautista, E., Williams, C., Wall, G., Orr, E., Elshikha, D.E.M., 2025. Evaluation and comparison of OpenET models for estimating soil water depletion of irrigated alfalfa in Arizona. Agric. Water Manag. 320, 109850. https://doi.org/10.1016/j.agwat.2025.109850
Elsadek, E., Zhang, K., Mousa, A., Ezaz, G.T., Tola, T.L., Shaghaleh, H., Hamad, A.A.A., Alhaj Hamoud, Y., 2023. Study on the in-field water balance of directseeded rice with various irrigation regimes under arid climatic conditions in Egypt using the AquaCrop model. Agronomy 13, 609. https://doi.org/10.3390/agronomy13020609
Elsadek, E.A., Attalah, S., Waller, P., Norton, R., Hunsaker, D.J., Williams, C., Thorp, K.R., Orr, E., Elshikha, D.E.M., 2025. Simulating Water Use and Yield for Full and Deficit Flood-Irrigated Cotton in Arizona, USA. Agronomy 15, 2023. https://doi.org/10.3390/agronomy15092023
Elsadek, E.A., Attalah, S., Williams, C., Thorp, K.R., Wang, D., Elshikha, D.E.M., 2026. Comparing Cotton ET Data from a Satellite Platform, In Situ Sensor, and Soil Water Balance Method in Arizona. Agriculture 16, 228. https://doi.org/10.3390/agriculture16020228
Elshikha, D.E., Attalah, S., Waller, P., Hunsaker, D.J., Thorp, K.R., Bautista, E., Williams, C., Wall, G.W., Orr, E., Elsadek, E.A., 2025a. Can OpenET Transform Irrigation Management in the Southwestern U.S.? College of Agriculture, Life, and Environmental Sciences, University of Arizona, USA.
Elshikha, D.E., Attalah, S., Waller, P., Weiss, J., Hunsaker, D., Thorp, K.R., Elsadek, E.A., 2025b. A Grower’s Guide on Selection and Use of Weather Stations for Improving Crop and Irrigation Management Decisions.
Thorp, K.R., 2022. pyfao56: FAO-56 evapotranspiration in Python. SoftwareX 19, 101208. https://doi.org/10.1016/jsoftx.2022.101208
Walter, I.A., Allen, R.G., Elliott, R., Itenfisu, D., Brown, P., Jensen, M.E., Mecham, B., Howell, T.A., Snyder, R., Eching, S., 2005. Task committee on standardization of reference evapotranspiration. ASCE Reston, VA, USA. Waller, P., Yitayew, M., 2016. Irrigation and Drainage Engineering. Springer International Publishing, Cham. https://doi.org/10.1007/978-3-319-05699-9