
Arizona Statewide Commercial Viticulture Needs Assessment
The inception of any good Cooperative Extension program requires direction. While an agent may have extensive experience working in a specific program area, every community is different and owns a unique set of challenges and concerns. The best resource to learn more about these issues is generally the community members, who know better than anyone about their own needs and priorities. From December 2022 to May 2023, the University of Arizona conducted a 49-question needs assessment throughout Arizona, directed at vineyard managers, viticulturists, and vineyard owners in order to develop a Commercial Viticulture Extension Program. Respondents stated that having a programmatic area agent for viticulture was their greatest priority, with top programming priorities for growers being irrigation, pest and insect management, disease management, soil fertility, weather, and weed management.
Introduction
The purpose of Extension is to support stakeholders with objective, science-based information developed through research and educational programming. The first step in providing this kind of assistance is to ask the community directly about their challenges and priorities. In Extension, there are two primary sources of community information. The first is the Advisory Board, a group of individuals appointed with the express purpose of supporting and consulting with local Extension to ensure that current and future programming is in fact meeting the needs of the stakeholders. The second source is the needs assessment, a survey which is designed to help the agent understand the community that they are working with, and the type of support that said community would like to receive from the university. Once these factors have been identified, the agent can design programming to address these stakeholders’ specific needs by identifying desired outcomes, the outputs to be produced, and the inputs necessary to achieve them.
Although grapes have been cultivated in what is now known as the state of Arizona since at least the eighteenth century, recent decades have ushered in a renaissance for the state’s industry (Berg, 2018). From 2012 to 2021, the Arizona wine industry has roughly doubled in both planted acreage and number of bonded wineries (Bickel et al, 2021). One indication of this growth has been the recent addition of two federally recognized American Viticultural Areas (Willcox established in 2016 and Verde Valley in 2021), which join the longstanding Sonoita American Viticultural Area (established in 1984). In response to this development, the University of Arizona Cooperative Extension has increased its viticultural programming in recent years, and in 2022, hired a statewide programmatic viticulture agent to enhance its support of this growing industry. To properly support an industry, an agent must understand who the members of this industry are, how they do business, and what types of traditional practices they use. Further, it is key for the agent to be aware of the needs and priorities of industry in order to maximize their effectiveness while delivering programming and creating scholarly contributions. The results of this assessment are organized by first describing the Arizona grape growing community and then expounding on the needs and priorities that the University can support. Within the later section, it is clear that the top priorities for Extension programming include irrigation, pest and insect management, disease management, weather, and weed management.
Materials and methods
Members of Cooperative Extension conducted the survey from December 2022 to May 2023 throughout Arizona using Qualtrics Software in an entirely online format accessible by web link or QR code. Respondents were contacted through the Yavapai College Viticulture and Enology Program, The Arizona Winegrowers Association, and word of mouth, including advertisement while the agent was out in the community delivering programming. The survey questions (see Appendix) were developed through the lead author’s previous knowledge of the U.S. wine industry and review and input from all authors. As this survey deals exclusively with viticulture (as opposed to winemaking or grape processing), it was advertised “Attention all growers, viticulturists, and vineyard owners!” in order to ensure that the correct demographic was solicited. Ultimately, 56 people responded to the survey, though not every question was answered by all respondents, and some questions gave the option for multiple selections within a single question.
Vitulture industry
Demographics of respondents
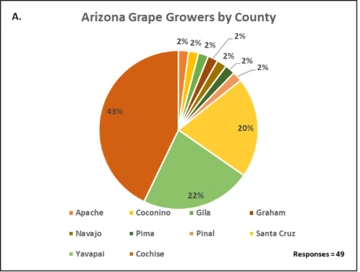
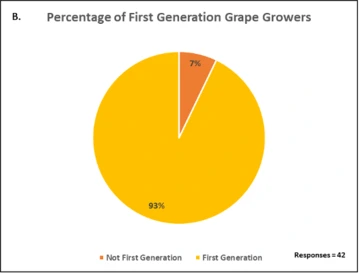
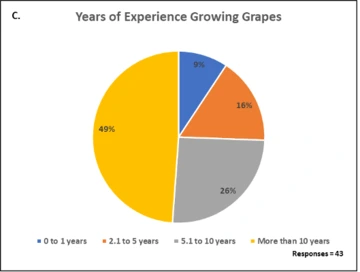
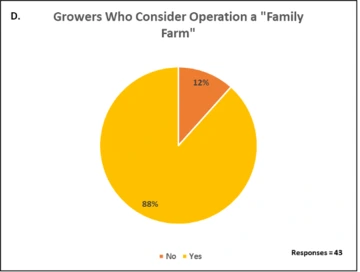
The survey results indicated that the majority of vineyards (by count, but not necessarily in terms of acreage) in Arizona are planted in Cochise County as this was the answer given by 43% of responses to the question “Please choose the county that your vineyard is planted in…”. This was followed by Yavapai County at 22%, Santa Cruz County at 20%, and Pinal, Pima, Navajo, Graham, Gila, Coconino, and Apache counties all at 2% (Figure 1A). Respondents did not report viticultural activity in the balance of the counties throughout the state. The majority (93%) of respondents identified as first-generation growers (Figure 1B). Regarding years of experience growing grapes, the most commonly selected choice (49%) was more than 10 years, with 26% reporting that they had been growing between 5 and 10 years, 16% between 2 and 5 years, and 9% at one year or less (Figure 1C). 88% of respondents reported that they considered their operation a “family farm” (Figure 1D).
Grape production and sales
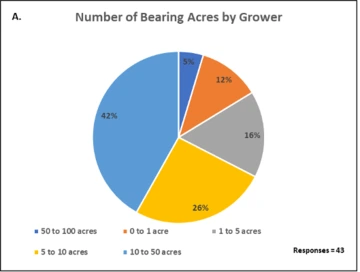
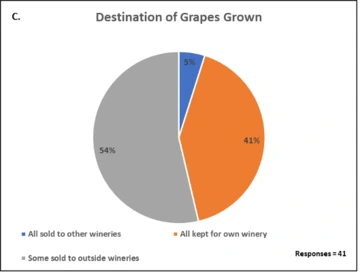
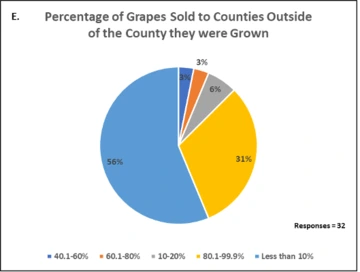
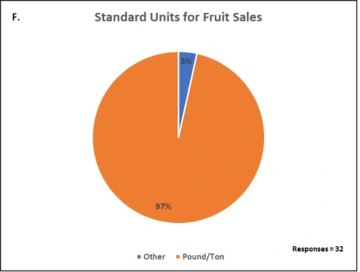
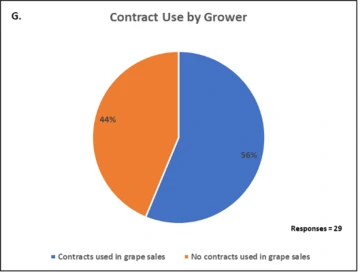
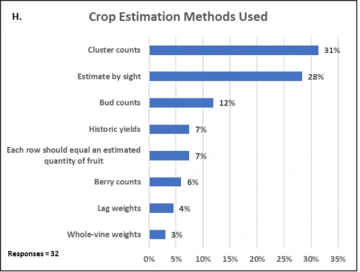
10 to 50 acres was the most common size of vineyard in production (planted and currently bearing fruit), the answer selected by 42% of respondents. This was followed by 5 to 10 acres (26%), 1 to 5 acres (16%), 0 to 1 acre (12%), 50 to 100 acres (5%) (Figure 2A). Zero respondents stated that they had more than 100 acres currently in production. In terms of non-bearing acres (planted acres, that are not yet producing fruit), 37% say that they had 0 to 1 acre, followed closely by 1 to 5 acres (35%). Responses of 50 to 100 acres and 10 to 50 acres were equal at 12% each, as well as More than 100 acres and 5 to 10 acres at 2% each (Figure 2B). When inquired as to the amounts of their grapes that they sold, 54% of growers said that they sold some of their grapes, while 41% said that they did not sell any of the grapes they grew, and 5% of growers said that they sold all of their grapes (Figure 2C). Of those growers that said that they did sell some of their grapes, the overwhelming majority (51%) said that they sold less than 10% of their fruit, followed by 20-40% at 17%, 40-60% at 14%, 80-99.9% at 9%, 10-20% at 6%, and 60.1-80% at 3% (Figure 2D). When inquiring about the destination of sold grapes, the majority of responses (56%) indicated that they sent less than 10% of their grapes to outside counties, while 31% said that they send more than 80% of their grapes to winemakers in other counties. Small numbers of respondents (6%, 3%, and 3%) stated that the percentage of grapes sent to an outside county was 10-20%, 60.1-80%, and 40.1-60%, respectively (Figure 2E). 97% of growers are paid by the ton (2,000 lbs.), as opposed to the acre (Figure 2F). Grape sales contracts were used by the majority of respondents (56%), while 44% did not (Figure 2G). In order to estimate the size of the crop for a given vintage, about a third of responses included cluster counts (31%) and/or estimating by sight (28%), while lesser amounts used Bud counts (12%), Historic yields (7%), Each row should equal an estimated quantity of fruit (7%), Berry counts (6%), Lag weights (4%), and Whole-vine weights (3%) (Figure 2H).


Cultural practices
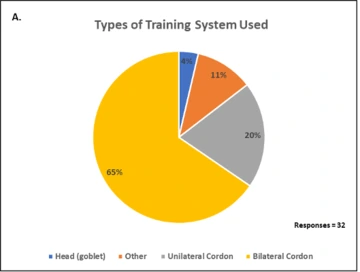
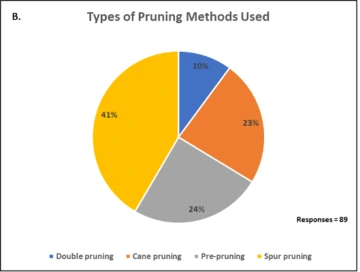
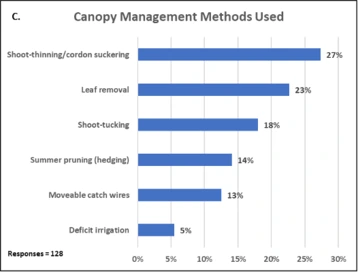
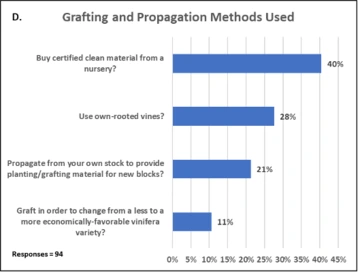
The bilateral cordon (permanent wood that is trained along a trellis wire) accounted for 65% of the chosen training systems used in the vineyard, with 20% selecting unilateral cordon, and 4% head-trained (Figure 3A). 41% of the responses indicated that their vines were spur-pruned, while about a quarter said that they used pre-pruning (24%) and/or cane pruning techniques (23%) (Figure 3B). Growers used multiple canopy management techniques, including shoot-thinning (27% of responses), leaf removal (23% of responses), and hedging (14% of responses). Only 5% of respondents stated that they used deficit irrigation to manage their canopy (Figure 3C). Regarding grafting and propagation, 40% of respondents stated that they use certified clean material from a nursery, while 21% propagate from their own stock in order to supply planting materials. 28% of grower respondents use own-rooted vines (Figure 3D).
Labor and mechanization
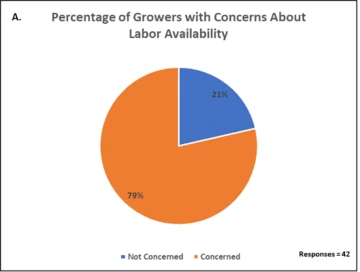
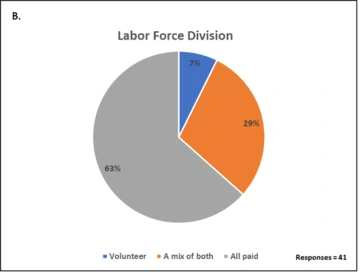
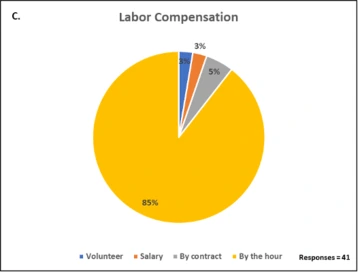
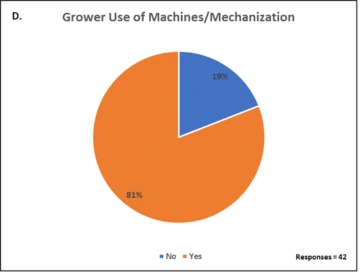
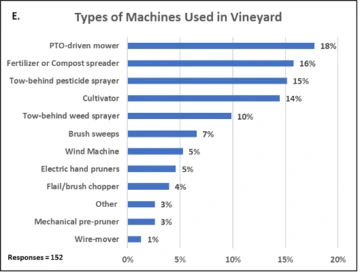
79% of respondents indicated that vineyard labor is an issue of concern for them (Figure 4A). The majority (63%) of growers use an all paid labor force, with 29% choosing a mix of both and 7% using all volunteer labor (Figure 4B). Wages were paid by the hour by 85% of respondents, with a small component stating that they used contract, volunteer, and salary regarding means of compensation (Figure 4C). Mechanization of one form or another was used in the vineyard by most growers (81%) (Figure 4D), with mower (18%), spreader (16%), tow-behind pesticide sprayer (15%), and cultivator (14%) being the most commonly employed machines (Figure 4E).
Industry needs and priorities
Extension programming
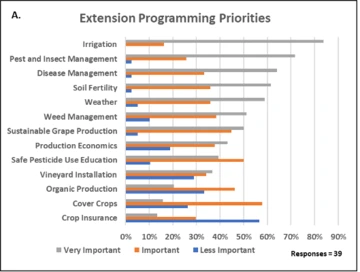
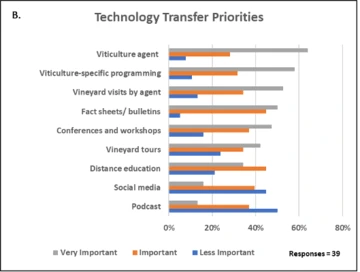
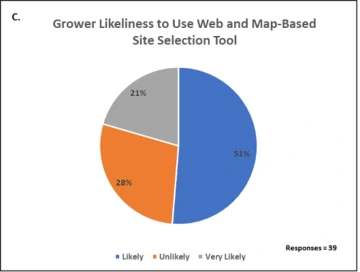
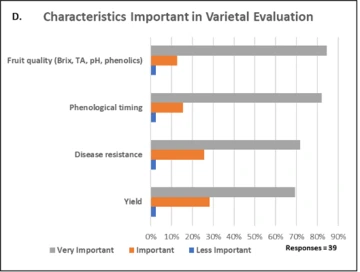
When asked how important specific viticultural Extension programming was to growers, the top choices for “Very Important” program topics were irrigation (84%), pest and insect management (72%), disease management (64%), soil fertility (62%), weather (59%), and weed management (51%) (Figure 5A). Growers stated that their highest priority for Extension/technology transfer was “…having an area agent for Viticulture…” (64%). Other “Very important” Extension/technology transfer priorities included viticulture-specific programming (58%), vineyard visits by agent (53%), and fact sheets/bulletins on viticultural practices (50%) (Figure 5B). 72% of respondents said that they would be “likely” or “very likely” to use a web- and map-based site selection tool (Figure 5C). Concerning potential varietal evaluations performed by the University of Arizona, fruit quality was found to have the greatest percentage of “very important” responses (85%), followed closely by phenological timing (82%), disease resistance (72%), and yield (69%) (Figure 5D).
Irrigation
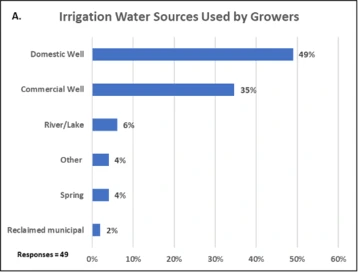
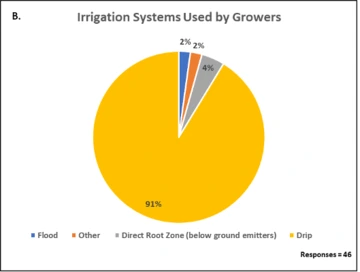
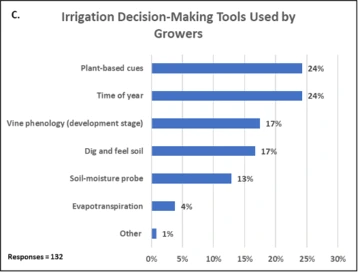
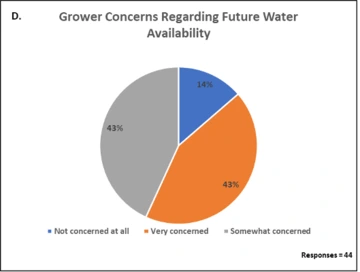
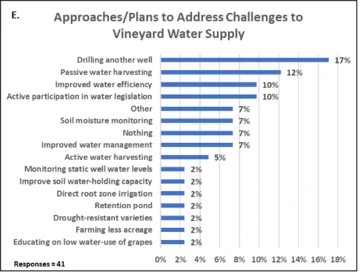
Wells (49% domestic and 35% commercial) were the most common source of water for Arizona grape growers (Figure 6A) with drip irrigation (91%) serving as the primary system type (Figure 6B). With regard to irrigation strategies, growers relied heavily on their ability to schedule water on both plant-based cues and the time of year (both 24% of responses) to decide when and how much water to apply, though phenology and soil condition also played a large role (17% each). Evapotranspiration accounted for 4% of responses (Figure 6C). When asked about their level of concern for future water availability, 86% of respondents stated that they were at least somewhat (if not very) concerned (Figure 6D). This question was followed-up by asking growers how they are or are planning to respond to these concerns. Responses varied, though drilling another well (17%), passive water-harvesting (12%), improved water efficiency (10%), and active participation in water legislation (10%) were among the most common answers (Figure 6E).
Pest and insect management
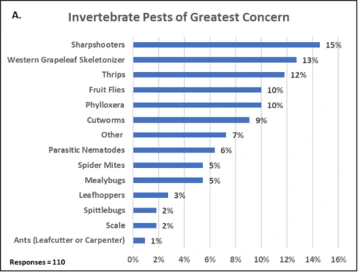
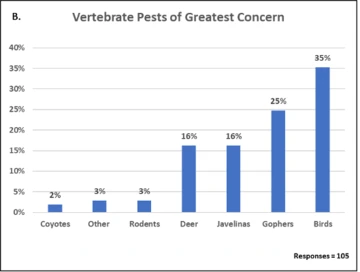
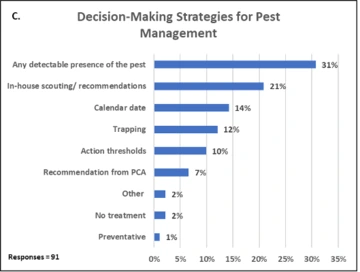
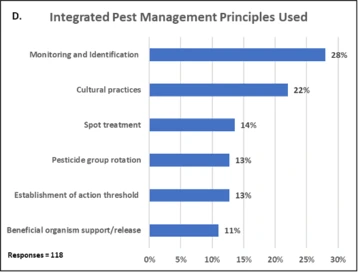
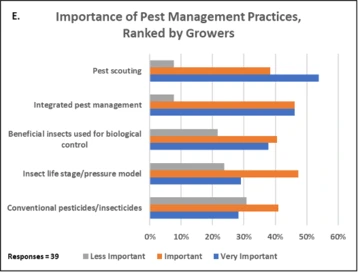
Pests of greatest concern to respondents included sharpshooters (15%), western grape leaf skeletonizer (13%), thrips (12%), fruit flies (10%), and phylloxera (10%) (Figure 7A). Among vertebrate pests, birds (35%) and gophers (25%) were the greatest concern for growers, with javelina and deer both representing 16% of responses (Figure 7B). When deciding when to treat for pests, the most common response was any detectable presence of the pest (31%), followed by in-house scouting and recommendations (21%), and calendar date (22%) (Figure 7C). The principles of integrated pest management most commonly used were monitoring and identification of pests (28%), cultural practices that deter pest establishment (22%), and targeted treatment where pest pressure is highest (22%) (Figure 7D). The most important management practices employed (considered “very important”) were pest scouting (54%), integrated pest management (46%), and beneficial insects used for biological control (38%) (Figure 7E).
Disease management
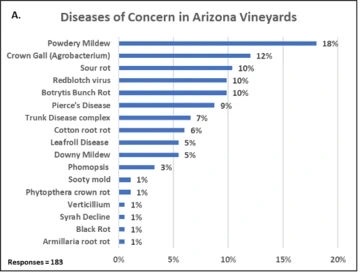
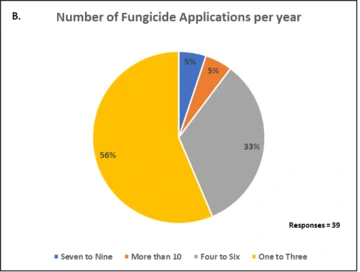
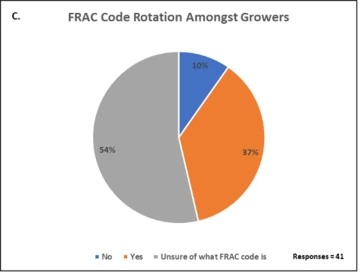
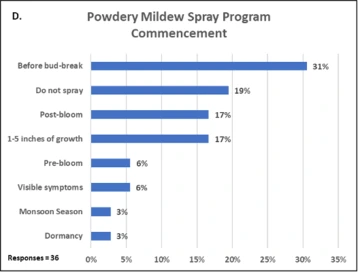
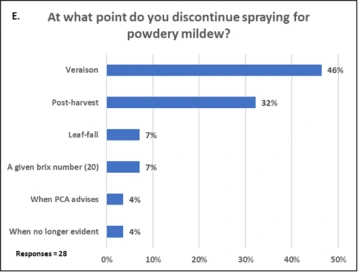
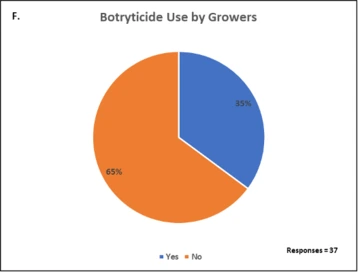
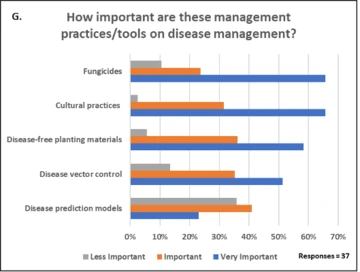
Diseases/ pathogens of greatest concern to the growers of Arizona included powdery mildew (18%), crown gall (12%), sour rot (10%), and grapevine redblotch virus (10%) (Figure 8A). Regarding the number of fungicide applications applied per year, the majority (56%) of responses showed that growers applied between one and three per year most commonly (Figure 8B). 64% of respondents either did not practice Fungicide Resistance Action Committee (FRAC) code rotation or were unsure of what a FRAC code is (Figure 8C). The majority of responses (31%) indicated that most growers began spraying for powdery mildew disease before bud-break, while the second most common answer (19%) was do not spray (indicating that no action was taken to prevent or eradicate powdery mildew), followed by post-bloom (17%), and 1-5 inches of growth (17%) (Figure 8D). The most common times for growers to discontinue spraying for powdery mildew at veraison (46%) and post-harvest (32%) (Figure 8E). 65% of grower responses indicated that they did not use botryticides for late-season rot control (Figure 8F). The most essential practices for disease control among respondents (rated as “very important”) were fungicides (66%) and cultural practices (shoot-thinning, leaf removal, and water management) (66%), while disease-free planting materials (58%) and disease vector control (51%) were also commonly chosen (Figure 8G).
photo
Soil fertility
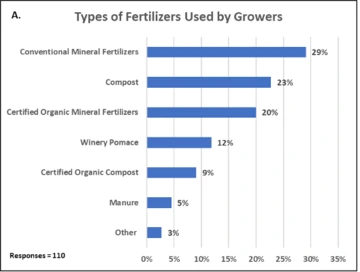
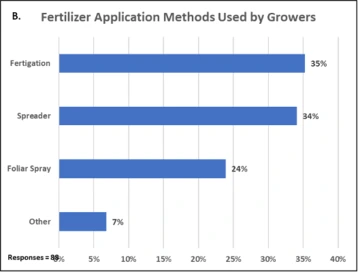
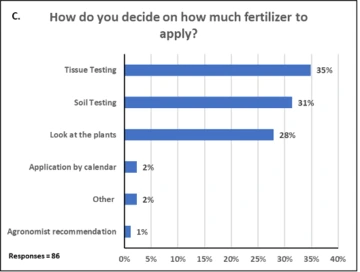
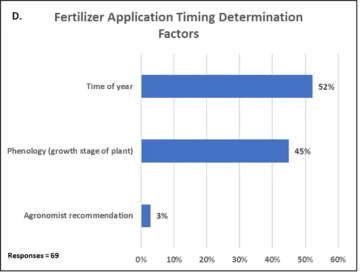
100% of growers fertilized or amended their soils in some manner, and the products most commonly used were conventional mineral fertilizers (29%), followed by compost (23%), and certified organic mineral fertilizers (20%), with winery pomace being used by 12% of respondents (Figure 9A). Growers responded that they most commonly used fertigation (35%) as a technique to apply products, with dry product spreaders (34%) receiving almost as many responses and 24% of respondents stating that they used foliar spray methods (Figure 9B). Tissue testing (35%) was the number one answer when growers were asked how they decided how much fertilizer to apply, though almost as many said that they employed soil testing (31%), and/or visual cues from the plants (Figure 9C). Regarding the determination of application timing, most growers applied products based on the time of year (52%) and phenology (45%), though a small percentage applied by agronomist recommendation (3%) (Figure 9D).
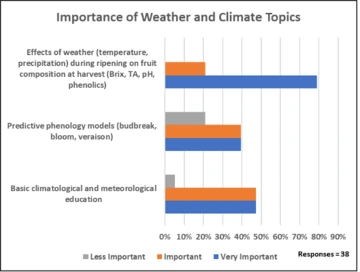
Weather
The effects of weather during ripening on harvest fruit composition was found to be the highest priority (79%) for growers of all weather and climate-related topic choices given, with regard to vineyard management (Figure 10).
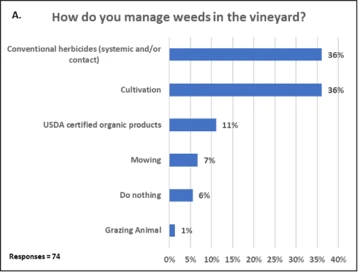
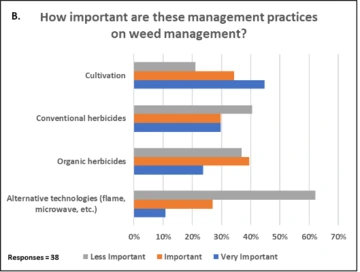
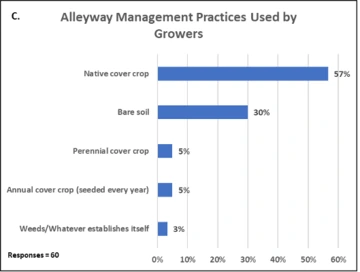
Weed management
Although growers stated that conventional herbicides and cultivation (both 36% of responses) were used with equal regularity on average (Figure 11A), the most important weed management practice for growers was cultivation (45%), followed by conventional herbicides (30%), organic herbicides (24%) and alternative technologies (11%) (Figure 11B). For the “alleyways” or areas between rows of grapes, growers most commonly grew a native cover crop (57%) or maintained bare soil (30%) (Figure 11C).
Conclusion
By conducting this needs assessment, The University of Arizona now has a better understanding of the needs and priorities of grape growers throughout the state and can use the resulting data to create impactful programming and scholarly contributions which will be rolled out to meet those needs directly. As respondents listed irrigation, pest and disease management, soil fertility, weather, and weed management as their top priorities, these topics will be the immediate, primary focus of Extension Commercial Viticulture Program, using specific answers to further narrow subject matters. What’s more, many of these priorities are interconnected. For example, proper irrigation management is often tied to canopy management, which is a crucial first line of defense within an integrated pest management program. This being said, it was not possible to reach every grower in the state and Extension work, by nature, is a moving target. As programming is delivered, new issues will arise and the understanding of the needs of growers will become even more apparent. Further, it is likely that more focused needs assessments will be needed in the future, or perhaps another, more extensive iteration in 5 years or so.
References
Berg, E., 2018. Equal age for age: The growth, death, and rebirth of an Arizona wine industry, 1700-2000. Journal of Arizona History Vol. 59, No. 3.
Bickel, A., Duval, D., Frisvold, G., 2021. Vineyards and wineries in Arizona: an economic contribution analysis. University of Arizona Cooperative Extension Department of Agriculture and Natural Resources Publication.
Appendix: Needs Assessment Survey Questions
Please choose the county that your vineyard is planted in (if you own/work multiple properties, you may choose more than one county.)
▢ Apache
▢ Cochise
▢ Coconino
▢ Gila
▢ Graham
▢ Greenlee
▢ La Paz
▢ Maricopa
▢ Mohave
▢ Navajo
▢ Pima
▢ Pinal
▢ Santa Cruz
▢ Yavapai
▢ Yuma
Are you a first-generation grower?
▢ YES
▢ NO
How long have you been growing grapes?
▢ 0 to 1 years
▢ 1.1 to 2 years
▢ 2.1 to 5 years
▢ 5.1 to 10 years
▢ More than 10 years
Water Management
What kind of water source do you use to irrigate? (Choose all that apply)
▢ Commercial Well
▢ Domestic Well
▢ Irrigation District
▢ River/Lake
▢ Other (Specify_______________________
What kind of irrigation system do you use? (Choose all that apply)
▢ Drip
▢ Overhead sprinkler
▢ Under-vine sprinkler
▢ Flood
▢ Center Pivot
▢ Direct Root Zone (below ground emitters)
▢ Other (Specify_______________________
How do you decide when and how much to irrigate the vines? (Choose all that apply)
▢ Time of year
▢ Vine phenology (development stage)
▢ Soil-moisture probe
▢ Look at plants (i.e., tendril turgor, shoot lenghts, leaf angles, shoot tips)
▢ Dig and feel soil
▢ Evapotranspiration
▢ Other (Specify_______________________
How concerned are you about water availability?
▢ Very concerned
▢ Somewhat concerned
▢ Not concerned at all
What approaches/plans are you utilizing or considering utilizing to address any challenges with water supply for or demand in your vineyard?
__________________________________________________________________________________________________________________________________________________
Fertility
Do you fertilize or amend your soil?
▢ YES
▢ NO
If so, what type of products do you use? (Choose all that apply)
▢ Conventional Mineral Fertilizers
▢ Certified Organic Mineral Fertilizers
▢ Compost
▢ Certified Organic Compost
▢ Winery Pomace
▢ Other (Specify_______________________
How do you apply your fertilizer? (Choose all that apply)
▢ Spreader
▢ Fertigation
▢ Foliar Spray
▢ Direct root-zone shanking
▢ Other (Specify_______________________
How do you decide on how much fertilizer to apply? (Choose all that apply)
▢ Tissue Testing
▢ Soil Testing
▢ Look at the plants
▢ Other (Specify_______________________
How do you determine when to apply fertilizer? (Choose all that apply)
▢ Phenology (growth stage of plant)
▢ Time of year
▢ Other (Specify_______________________
Cultural Practices
What kind of training Systems do you Use? (Choose all that apply)
▢ Bilateral Cordon
▢ Unilateral Cordon
▢ Head (gloves)
▢ Head (for cane pruning)
▢ Fan (multiple trunks in a palmate configuration)
▢ Geneva Double Curtain
▢ Other (Specify_______________________
What types of pruning methods do you use? (Choose all that apply)
▢ Spur pruning
▢ Cane pruning
▢ Minimal pruning
▢ Precision mechanical pruning
▢ Pre-pruning
▢ Double pruning
▢ Other (Specify_______________________
What type of canopy management methods do you use? (Choose all that apply)
▢ Shoot-thining/cordon suckering
▢ Leaf removal
▢ Summer pruning (hedging)
▢ Deficit irrigation
▢ Shoot-tucking
▢ Moveable catch wires
▢ Other (Specify_______________________
What practices do you use for the area between rows of grapes? (Choose all that apply)
▢ Bare soil
▢ Annual cover crop (seeded every year)
▢ Perennial cover crop
▢ Native cover crop
▢ Other (Specify_______________________
Regarding grafting and propagation, do you: (Choose all that apply)
▢ Use own-rooted vines?
▢ Graft in order to change from a less to a more economically favorable vinifera variety?
▢ Propagate from your own stock to provide planting/grafting material for new blocks?
▢ Buy certified clean material from a nursery?
Pest Management
What types of pests are you concerned with in your vineyard? (Choose all that apply)
▢ Powdery Mildew
▢ Downy Mildew
▢ Botrytis Bunch Rot
▢ Sour rot
▢ Crown Gall (Agrobacterium)
▢ Leafroll Disease associated viruses
▢ Redblotch virus
▢ Phomopsis Cane and Leaf Blight
▢ Sooty mold
▢ Cotton (Phymatotrichum) root rot
▢ Phytopthera crown rot
▢ Armillaria root rot
▢ Trunk Disease complex
▢ Pierce’s Disease (Xylella fastidiosa)
▢ Other (Specify_______________________
How many fungicide applications do you typically make per year?
▢ 1-3
▢ 4-6
▢ 7-9
▢ More than 10
Do you practice the rotation of FRAC codes?
▢ YES
▢ NO
▢ Unsure of what FRAC code is
At what point do you begin spraying for powdery mildew?
▢ Before bud-break
▢ 1-5 inches of growth
▢ Pre-bloom
▢ Post-bloom
▢ Other (Specify_______________________
At what point do you discontinue spraying for powdery mildew?
▢ A given number of days post-bloom (Specify)
▢ A given fruit size (Specify)
▢ A given brix number (Specify)
▢ Veraison
▢ Post-harvest
▢ Leaf-fall
Do you use botryticides for late-season rot control?
▢ YES
▢ NO
What types of vertebrates pose a major issue in the vineyard? (Choose all that apply)
▢ Birds
▢ Deer
▢ Gophers
▢ Javelinas
▢ Other (Specify_______________________
How do you decide when to treat for vineyard pests? (Choose all that apply)
▢ Calendar date
▢ Any detectable presence of the pest
▢ Waiting to treat until economic thresholds have been crossed
▢ Recommendation from pest control advisor
▢ In-house scouting and recommendations
▢ Leafroll Disease associated viruses
▢ Trapping
▢ No treatment
▢ Other (Specify_______________________
Do you use any of the following principles in your pest management program? (Choose all that apply)
▢ Establishment of action threshold (level of pest pressure at which you act)
▢ Monitoring and Identification of pests
▢ Cultural practices that deter pest establishment
▢ Targeted area of treatment where pest pressure is highest
▢ Pesticide group (FRAC, IRAC, HRAC number) rotation
▢ Beneficial organism support/release
How do you manage weeds in the vineyard? (Choose all that apply)
▢ Conventional herbicides (systemic and/or contact)
▢ USDA certified organic products
▢ Cultivation
▢ Do nothing
▢ Other (Specify_______________________
Labor/Machines
Is labor an issue of concern for your vineyard operation?
▢ YES
▢ NO
Is your labor force...
▢ All paid
▢ Volunteer
▢ A mix of both
How do you pay your labor?
▢ By the hour
▢ By contract
▢ Other (Specify_______________________
Do you use machines/mechanization in your vineyard operation?
▢ YES
▢ NO
If so, what type? (Choose all that apply)
▢ Mechanical pre-pruner
▢ Electric hand pruners
▢ Cultivator
▢ Tow-behind pesticide sprayer
▢ Tow-behind weed sprayer
▢ Fertilizer or Compost spreader
▢ Wire-mover
▢ PTO-driven mower
▢ Flail/brush chopper
▢ Brush sweeps
▢ Wind Machine
▢ Other (Specify_______________________
Vineyard and Ownership Questions
(Please only answer the following questions if you are the owner of a vineyard property in Arizona)
Is your operation a family farm?
▢ YES
▢ NO
How many acres does your vineyard have in production (planted and currently bearing fruit)?
▢ 0 to 1 acre
▢ 1 to 5 acres
▢ 5 to 10 acres
▢ 10 to 50 acres
▢ 50 to 100 acres
▢ More than 100 acres
How many non-bearing acres does your vineyard consist of (planted, but not currently producing)?
▢ 0 to 1 acre
▢ 1 to 5 acres
▢ 5 to 10 acres
▢ 10 to 50 acres
▢ 50 to 100 acres
▢ More than 100 acres
Do you sell:
▢ All of your grapes?
▢ Some of your grapes (keep a percentage for your own winery)?
▢ None of your grapes (keep all of your grapes for your own winery)?
What percentage of your grapes do you sell to outside wineries? (approximately)
▢ Less than 10%
▢ 10-20%
▢ 20.1-40%
▢ 40.1-60%
▢ 60.1-80%
▢ 80.1-99.9%
What percentage of your grape sales go to counties outside of the county your vineyard is planted in? (approximately)
▢ Less than 10%
▢ 10-20%
▢ 20.1-40%
▢ 40.1-60%
▢ 60.1-80%
▢ 80.1-99.9%
If you sell your fruit, what unit are you paid by?
▢ Pound/Ton
▢ Acre
▢ Other (Specify_______________________
How important is University/Extension programming on the following grape production topics?
| Less Important | Important | Very Important |
Soil Fertility | ▢ | ▢ | ▢ |
Weed Management | ▢ | ▢ | ▢ |
Organic Production | ▢ | ▢ | ▢ |
Cover Crops | ▢ | ▢ | ▢ |
Sustainable Grape Production | ▢ | ▢ | ▢ |
Production Economics | ▢ | ▢ | ▢ |
Crop Insurance | ▢ | ▢ | ▢ |
Vineyard Installation | ▢ | ▢ | ▢ |
Weather | ▢ | ▢ | ▢ |
Disease Management | ▢ | ▢ | ▢ |
Pest and Insect Management | ▢ | ▢ | ▢ |
Safe Pesticide Use Education | ▢ | ▢ | ▢ |
Irrigation | ▢ | ▢ | ▢ |
How important are these management practices on soil fertility?
| Less Important | Important | Very Important |
Vine nutrition basics | ▢ | ▢ | ▢ |
Nutrient Recommendations pre- and post-planting | ▢ | ▢ | ▢ |
Soil sampling, testing and interpretation of results | ▢ | ▢ | ▢ |
Plant tissue analysis sampling, testing and interpretation of results | ▢ | ▢ | ▢ |
Cover-cropping | ▢ | ▢ | ▢ |
Using compost or other amendments | ▢ | ▢ | ▢ |
How important are these management practices on weed management?
| Less Important | Important | Very Important |
Conventional herbicides | ▢ | ▢ | ▢ |
Organic herbicides | ▢ | ▢ | ▢ |
Cultivation | ▢ | ▢ | ▢ |
Alternative technologies (flame, microwave, etc.) | ▢ | ▢ | ▢ |
How important are these management practices/tools on disease management?
| Less Important | Important | Very Important |
Cultural practices such as shoot-thinning and leaf removal, water management | ▢ | ▢ | ▢ |
Fungicides | ▢ | ▢ | ▢ |
A disease prediction model | ▢ | ▢ | ▢ |
Plant pathology models for predicting powdery mildew primary infection periods | ▢ | ▢ | ▢ |
Disease-free planting materials | ▢ | ▢ | ▢ |
Disease vector control | ▢ | ▢ | ▢ |
How important are these management practices on pest and insect management?
| Less Important | Important | Very Important |
Conventional pesticides/insecticides | ▢ | ▢ | ▢ |
Insect life stage/pressure model | ▢ | ▢ | ▢ |
Beneficial insects used for biological control | ▢ | ▢ | ▢ |
Integrated pest management | ▢ | ▢ | ▢ |
Pest scouting | ▢ | ▢ | ▢ |
How important are the following weather and climate-related topics to the management of the vineyard?
| Less Important | Important | Very Important |
Basic climatological and meteorological education | ▢ | ▢ | ▢ |
Predictive phenology models (budbreak, bloom, veraison) | ▢ | ▢ | ▢ |
Effects of weather (temperature, precipitation) during ripening on fruit composition at harvest (Brix, TA, pH, phenolics) | ▢ | ▢ | ▢ |
Extension/ Technology Transfer
| Less Important | Important | Very Important |
How important are extension/ education services to you? | ▢ | ▢ | ▢ |
How important is having an area agent for Viticulture in Arizona? | ▢ | ▢ | ▢ |
Extension programming on specific aspects of viticulture | ▢ | ▢ | ▢ |
Fact sheets/ bulletins on viticultural practices | ▢ | ▢ | ▢ |
Conferences and workshops | ▢ | ▢ | ▢ |
Vineyard tours | ▢ | ▢ | ▢ |
Vineyard visits by extension agents | ▢ | ▢ | ▢ |
Distance education | ▢ | ▢ | ▢ |
Social media | ▢ | ▢ | ▢ |
Podcast | ▢ | ▢ | ▢ |
How likely would you be to use a web- and map-based site selection tool?
▢ Unlikely
▢ Likely
▢ Very Likely
How important would varietal evaluations regarding the following characteristics be?
| Not at all important | Slightly important | Moderately important |
Disease resistance | ▢ | ▢ | ▢ |
Fruit quality (Brix, TA, pH, phenolics) | ▢ | ▢ | ▢ |
Yield | ▢ | ▢ | ▢ |
Phenological timing (budbreak, bloom, ripening) | ▢ | ▢ | ▢ |