
2018-2019 El Niño Overview for Arizona
El Niño conditions are developing in the tropical Pacific Ocean and current forecasts show that a weak or moderate event is very possible this winter and spring1,2. Were a weak or moderate event to happen, what might this mean for Arizona? Will it be cooler than usual? Will rain and snow amounts be greater? Will there be relevant related hazards or favorable circumstances? In this Extension Climate Fact Sheet about the potential 2018-2019 El Niño event, we start to answer such questions by providing an overview of this phenomenon and how it possibly will influence weather across the state during the coming months.
In order to make this information available to Arizona counties as quickly as possible, we are publishing this Extension Climate Fact Sheet only with review by University of Arizona faculty.
El Niño events
An El Niño event takes place when warmer-than-average water moves into the central and eastern tropical Pacific Ocean in conjunction with a weakening of the overlying winds that blow towards the west. Large areas of rising air and precipitation track this warm water and, due to their change in location, can substantially alter the position of the storm track relative to the Southwest during fall, winter, and spring. El Niño events usually occur once every three to five years, lasting from nine to 12 months and peaking in strength during the northern hemisphere winter3. Despite these typical features, no two El Niño events are alike.
Influences on cool-season weather
Changes brought about by an El Niño event can shift the winter storm track southward such that it passes through the Southwest more frequently. This potentially leads to a higher number of storms that pass through the region, some of which can bring considerable moisture. These circumstances increase the odds for cooler temperatures and above-average precipitation in Arizona during fall, winter, and spring months4 (Figures 1 and 2).
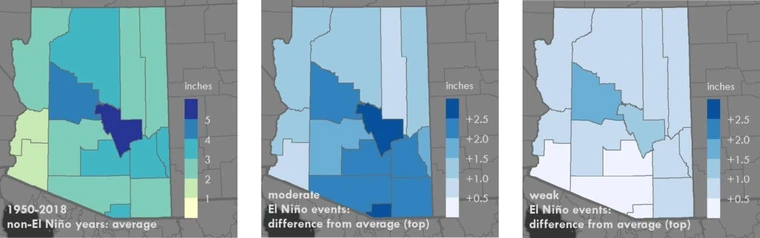
Figure 1. On average, December-February precipitation totals have been greater during weak and moderate El Niño events than during non-El Niño years (5).

Figure 2. On average, December-February temperatures have been warmer during weak El Niño events than during non-El Niño years, and cooler during moderate El Niño events (5).
Influences on cool-season weather in Arizona
Yes. The warmer the water that moves into the central and eastern tropical Pacific Ocean, the stronger the El Niño event and the greater the chances for above- average precipitation and relatively cooler temperatures in the Southwest. As current forecasts indicate that only a weak or moderate event is possible this winter and next spring1,2, such regional conditions are more likely but not heavily favored.
Precipitation variance
On average, above-normal precipitation amounts have occurred during weak and moderate El Niño events since 1950, as compared to non-El Niño years (Figure 1). However, there is considerable variability among these events. Rain and snow totals from December through February in much of Arizona were higher than normal in six of the 12 El Niño events categorized as weak, and five of the six El Niño events categorized as moderate6.
Temperature variance
On average, above-normal temperatures have occurred during weak El Niño events since 1950, as compared to non-El Niño years, whereas below-normal temperatures are associated with moderate El Niño events (Figure 2). Partial explanation of this contrast may be due to temperatures from December through February in much of Arizona having been lower than normal in only four of 12 weak El Niño events, but in five of six moderate El Niño events7.
Possible impacts
Above-average precipitation that might result from a 2018-2019 El Niño event could lead to a mix of related hazards and favorable circumstances that are relevant to agriculture, forestry and wildland fire management, human health and safety, property, ranching, and water resources. For example, El Niño events can lead to an increased average and higher variability in streamflow and flood size due to increased precipitation.
More information
Along with near-term weather forecasts from the National Weather Service (NWS), the NWS Climate Prediction Center issues extended range outlooks for 6-10 and 8-14 days, as well as monthly and seasonal climate outlooks. These map products show probabilities of temperature and precipitation being either below average, normal, or above average during these time frames. Also, in addition to Extension Climate Fact Sheets like this one, climate specialists and scientists of Cooperative Extension are working with the Climate Assessment for the Southwest (CLIMAS) to provide more information related to the potential 2018-2019 El Niño event. Please contact us for further information, data, and analysis that could be applied to stakeholder needs in your county.
References
- International Research Institute
- National Weather Service Climate Prediction Center
- National Oceanic and Atmospheric Administration (NOAA)
- NOAA Pacific Marine Environmental Laboratory
- data from NOAA National Centers for Environmental Information Climate at a Glance
- U.S. winter precipitation during every El Niño since 1950
- U.S. winter temperatures for every El Niño since 1950